Buyers’ momentum may increase
AUDUSD Price Analysis – 17 May
In case buyers are successful in holding the $0.66 support level, AUDUSD may rise above the $0.67, $0.68, and $0.69 resistance levels. The price may fall as a result of the downward momentum to levels of $0.65 and $0.63 if sellers gain more traction. The support level of $0.66 may be broken lower.
AUD/USD Market
Key levels:
Resistance levels: $0.67, $0.68, $0.69
Support levels: $0.66, $0.65, $0.63
AUDUSD Long-term Trend: Bullish
AUDUSD’s daily chart shows a positive trend. A double bottom chart pattern forms on the daily time period. On March 7, the $0.65 level of support was put to the test. At the previous level, a bullish engulfing candle pattern may be seen. This can indicate market bulls who are agitated. The price increased past the trustworthy $0.66 threshold. After overcoming the obstacle, the price moves up and tested the $0.67 resistance wall. Bullish momentum is having difficulty rising beyond $0.67 level, it pulls back retesting the $0.66 level.
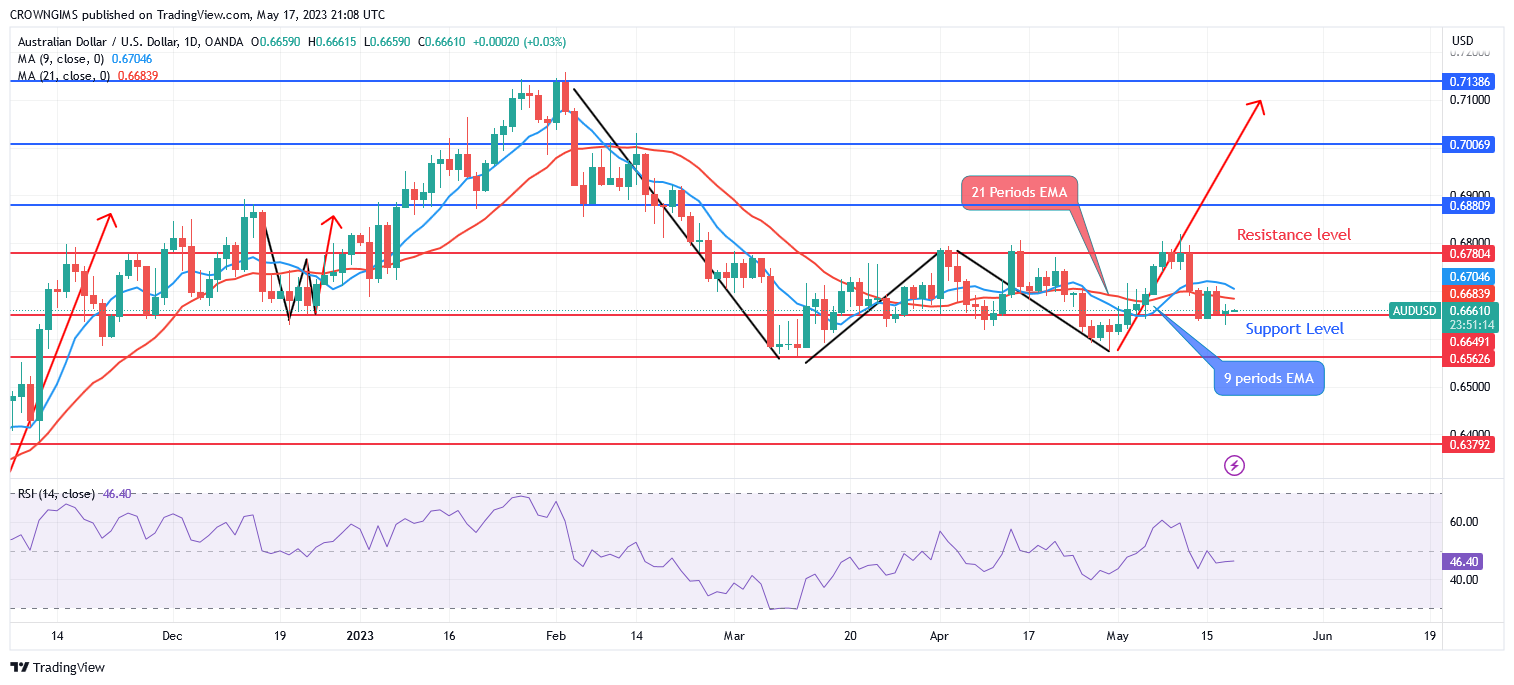
The currency pair is trading below the 9-period and 21-period exponential moving averages, which suggests a bearish pullback. In case buyers are successful in holding the $0.66 support level, AUDUSD may rise above the $0.67, $0.68, and $0.69 resistance levels. The price may fall as a result of the downward momentum to levels of $0.65 and $0.63 if sellers gain more traction. The support level of $0.66 may be broken lower.
AUDUSD medium-term Trend: Bearish
AUDUSD is bearish on the 4-hour chart. Prior to a few weeks ago, the price started to rise and challenge the $0.67 resistance level. While being supported by sellers close to the stated level, the price declined toward the previous low of $0.65. Customers now halt vendors even before they enter the market. Last week, the price tested the previous low once more, forming a double-bottom chart pattern. The sellers dominate the market.
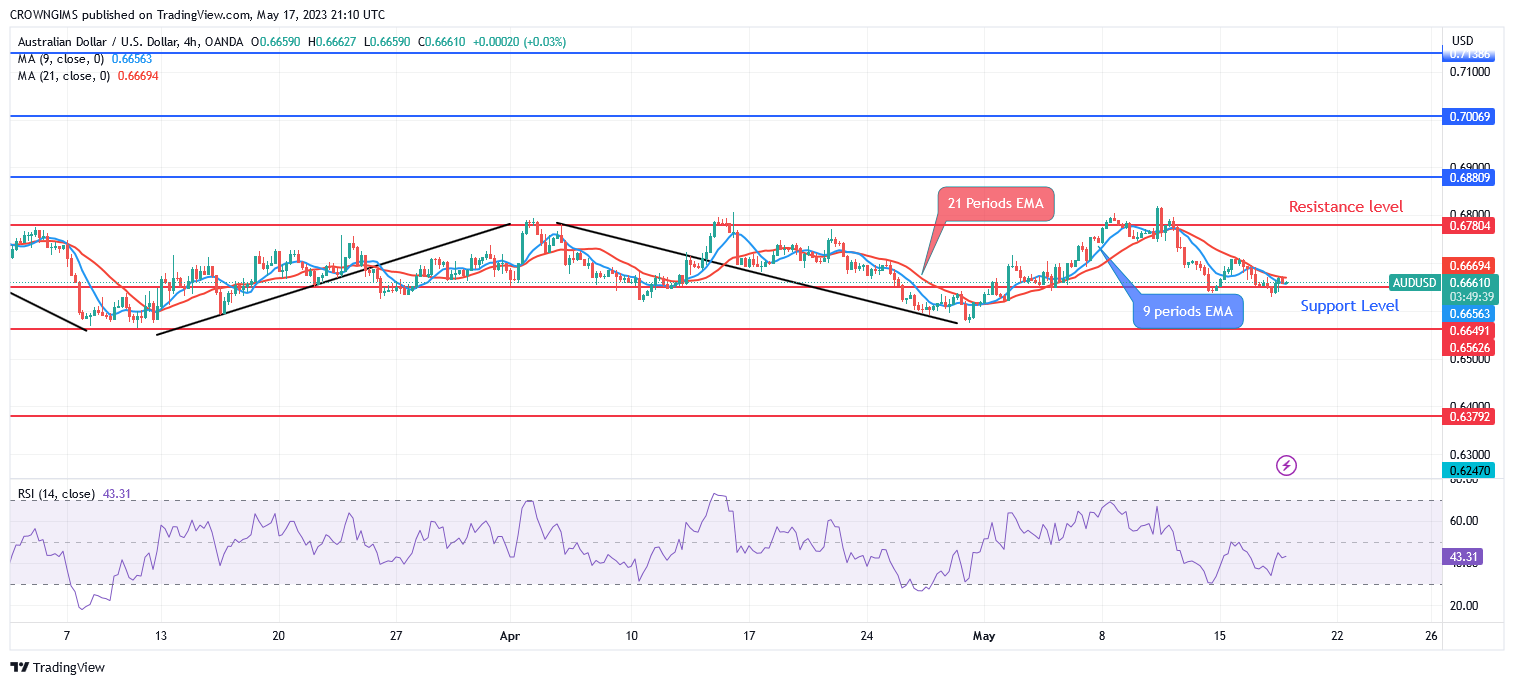
AUDUSD is trading below the 9-period and 21-period exponential moving averages. Relative Strength Index period 14 pointing up at 43 levels, indicating a buy signal.
You can purchase Lucky Block here. Buy LBLOCK
- Broker
- Min Deposit
- Score
- Visit Broker

- Award-winning Cryptocurrency trading platform
- $100 minimum deposit,
- FCA & Cysec regulated

- 20% welcome bonus of upto $10,000
- Minimum deposit $100
- Verify your account before the bonus is credited
- Fund Moneta Markets account with a minimum of $250
- Opt in using the form to claim your 50% deposit bonus
Learn to Trade
Never Miss A Trade Again

Signal Notification
Real-time signal notifications whenever a signal is opened, closes or Updated

Get Alerts
Immediate alerts to your email and mobile phone.

Entry Price Levels
Entry price level for every signal Just choose one of our Top Brokers in the list above to get all this free.