</p>
Price is consolidating around
S&P 500 Price Analysis – 10 February
$6906, $6950, and $7020 are potential resistance levels for the S&P 500. The stability of the $6757 level is the basis for this prognosis. A decline below the $6757 support level might push the price down the $6589 and $6473 levels.
Key Levels:
Resistance levels: $6906, $6950, $7020
Support levels: $6757, $6589, $6473
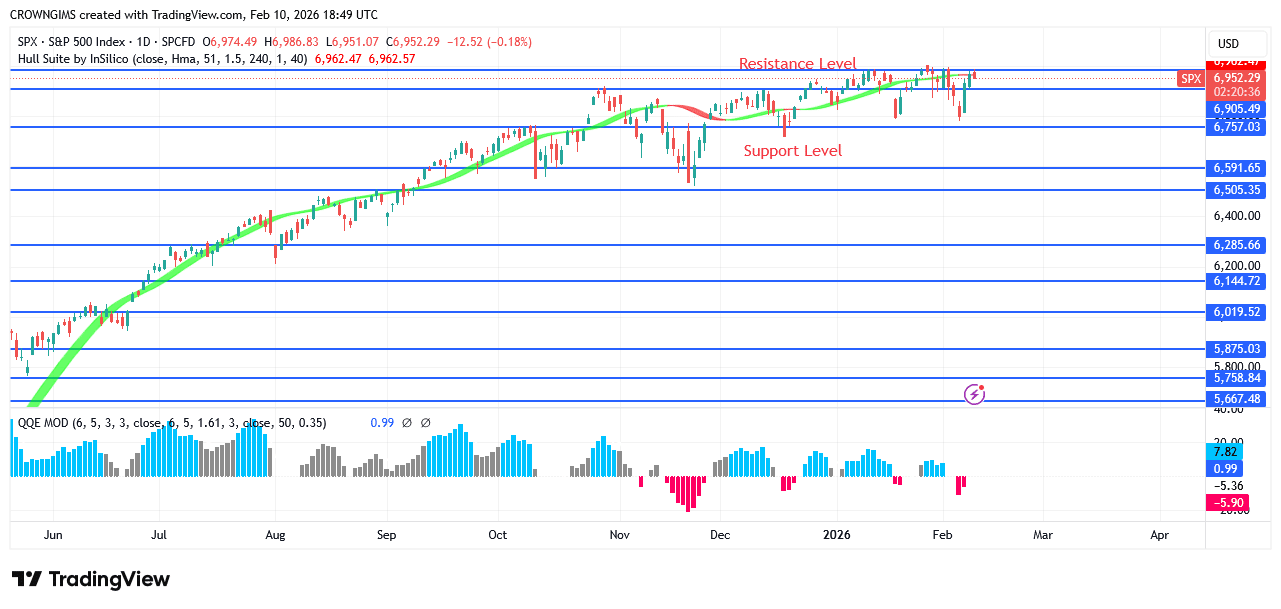
S&P 500 Long-term trend: Bullish
The S&P 500 Index is currently trending upward on its daily chart. For the last three months, the market has been dominated by bullish conditions. Since February 19, price increases have been the index’s primary driver. On September 6, there was another attempt to hit the $6757 milestone, and this time it worked.
Soon, S&P 500 Will Reach $7500
S&P500 $7500 soon pic.twitter.com/W3ZWdm8EuX
— Myles G Investments (@MylesGinvest) February 9, 2026
The price was able to stop further upward movement by momentarily settling at the starting level. The double-top bearish reversal pattern may not hold at $6950. The S&P 500 has increased from $6155 to the crucial resistance level of $6906. The price is still approaching its prior top, though.
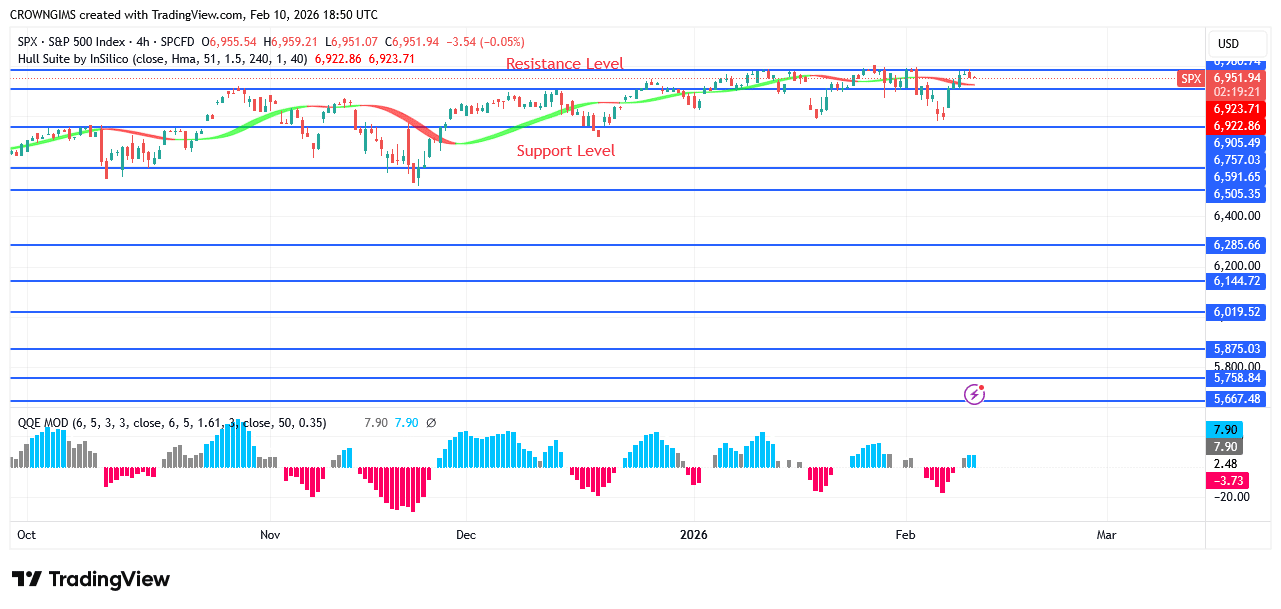
S&P 500 Medium-term Trend: Bullish
The 4-hour chart of the S&P 500 shows an upward trend. Over the previous week, the price has been unable to break over $6906 due to strong bullish support. Despite a steady rise, the bulls have held onto their positions. However, the price is currently moving quickly toward $6906 due to an engulfing candlestick pattern. The value of the S&P 500 has been increasing ever since it recovered from the $6757 mark.
Start using a world-class auto trading solution
You can purchase Lucky Block here. Buy LBLOCK
Related Resources
- Crypto Trading Signals — real-time alerts for BTC, ETH, SOL and XRP
- VIP Trading Signals — join 40,000+ traders getting early signals
- Broker
- Min Deposit
- Score
- Visit Broker

- Award-winning Cryptocurrency trading platform
- $100 minimum deposit,
- FCA & Cysec regulated

- 20% welcome bonus of upto $10,000
- Minimum deposit $100
- Verify your account before the bonus is credited
- Fund Moneta Markets account with a minimum of $250
- Opt in using the form to claim your 50% deposit bonus
Learn to Trade
Never Miss A Trade Again

Signal Notification
Real-time signal notifications whenever a signal is opened, closes or Updated

Get Alerts
Immediate alerts to your email and mobile phone.

Entry Price Levels
Entry price level for every signal Just choose one of our Top Brokers in the list above to get all this free.