
Bulls maintain their momentum
S&P 500 Price Analysis – 03 February
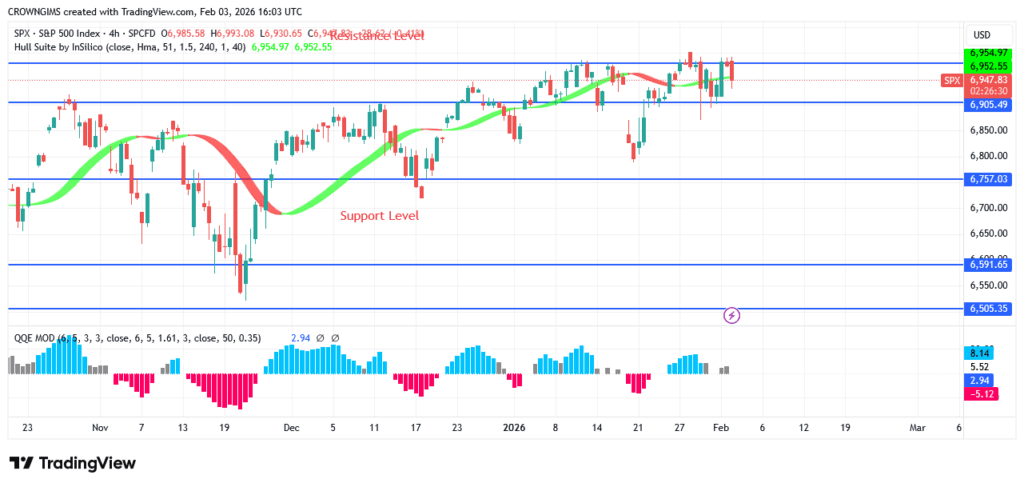
The S&P 500 may hit the resistance levels of $6906, $6950, and $7020. This prediction is predicated on the $6757 level staying steady. The price may move toward the $6589 and $6473 levels if it drops below the $6757 support level.
Key Levels:
Resistance levels: $6906, $6950, $7020
Support levels: $6757, $6589, $6473
S&P 500 Long-term trend (Daily): Bullish
The S&P 500 Index is currently trending upward on its daily chart. For the last three months, the market has been dominated by bullish conditions. Since February 19, price increases have been the index’s primary driver. On September 6, there was another attempt to hit the $6757 milestone, and this time it worked. The price was able to stop further upward movement by momentarily settling at the starting level. The double-top bearish reversal pattern may not hold at $6950. The S&P 500 has increased from $6155 to the crucial resistance level of $6906. The price is still approaching its prior top, though.

The S&P 500 May Hit 8,000 in 2026, According to JPMorgan.
We are gonna cto the s&p 500 https://t.co/961YxezVqS pic.twitter.com/cx16IMHQjQ
— toly 🇺🇸 (@toly) November 27, 2025
The price may move toward the $6589 and $6473 levels if it drops below the $6757 support level. The QQE MOD histogram and the Hull Suite cryptocurrency signals both point to possible purchasing opportunities. The general mood of the market may improve.
S&P 500 Medium-term Trend (H4): Bullish
The S&P 500’s 4-hour chart displays a rising trend. Strong bullish support has prevented the price from rising above $6906 over the past week. The bulls have maintained their positions despite a consistent increase. However, an engulfing candlestick pattern is currently causing the price to move swiftly toward $6906. Since the S&P 500 rebounded from the $6757 mark, its value has been rising.

The Hull Suite is currently less expensive than the S&P 500. When the QQE MOD index rises over zero, a strong purchasing signal is produced.
Start using a world-class auto trading solution
You can purchase Lucky Block here. Buy LBLOCK


