Bulls’ Momentum Increases in Polygon Market
Polygon (MATICUSD) Price Analysis – 01 January
In case the bears’ momentum picks up any further, Polygon might fall below the $0.76 mark and be exposed to the $0.70 and $0.65 levels. If buyers manage to hold on to the $0.76 support level, Polygon will increase and may break through the $0.87 resistance level, which could cause the price to increase to the $0.93 and $1.01 resistance levels.
Key Levels:
Resistance levels: $0.87, $0.93, $1.01
Support levels: $0.76, $0.70, $0.65
MATIC/USD Long-term Trend: Bearish
The long-term outlook is bearish for the MATIC/USD pricing. The pricing for MATIC/USD is not looking good in the long run. The Polygon traded between $0.93 and $0.89 over the past three weeks. When sellers gathered further momentum, the price was compelled to fall and break through the previous support level of $0.87. The $0.76 support level was tested on December 16. It backed off. The coin was testing the $0.76 support level yesterday as sellers dominated the market. Today, buyers are gaining more pressure and price may increase.
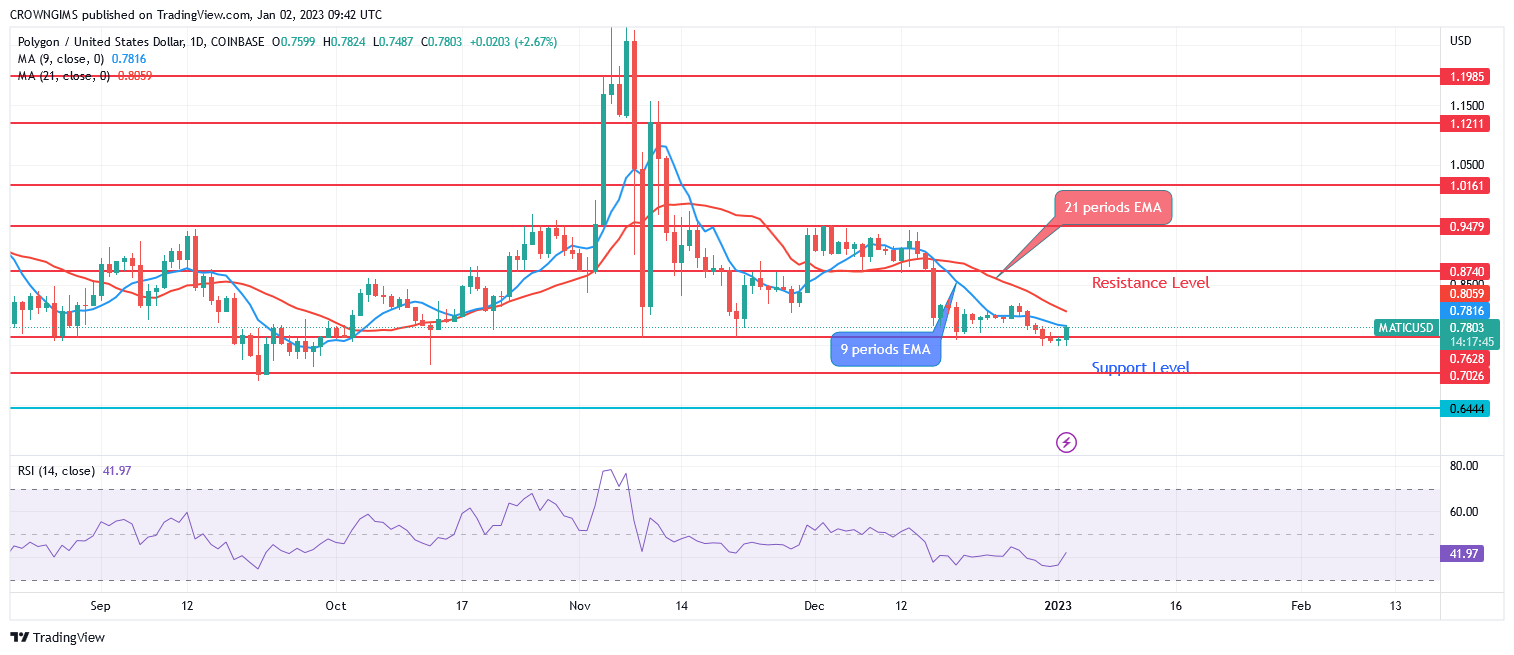
MATIC is trading below both the 9- and 21-period exponential moving averages in close contact, indicating a bearish market. The downside of the fast-moving average has crossed the slow-moving average. In case the bears’ momentum picks up any further, the price might fall below the $0.76 mark and be exposed to the $0.70 and $0.65 levels. If buyers manage to hold on to the $0.76 support level, Polygon will increase and may break through the $0.87 resistance level, which could cause the price to increase to the $0.93 and $1.01 resistance levels.
MATIC/USD Short-term Trend: Bullish
In the medium run, Polygon is on the bullish movement. A few weeks ago, the coin’s price was held at $0.93, and it was impossible to move past it. Sellers increased pressure on December 16 to drive the price below the $0.87 support level. The bears’ power was inadequate last week to lower it below the $0.76 mark. The current price for Polygon is increasing towards $0.87 resistance level.
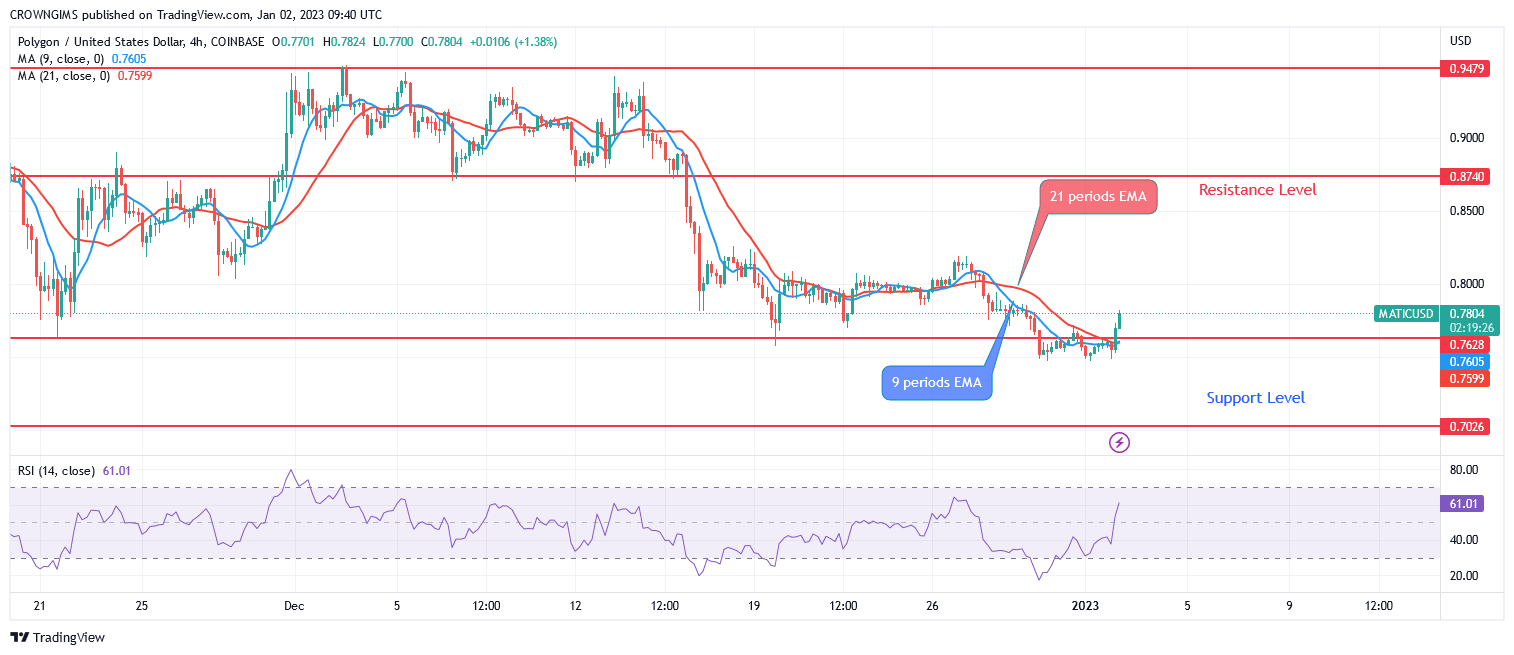
The Polygon price moving above the two EMAs as a sign of a bullish market. The 9-day EMA is trying to cross the 21-period EMA. At 59 levels, the signal line on the relative strength index period 14 is showing a clear positive direction.
You can purchase Lucky Block – Guide, Tips & Insights | Learn 2 Trade here. Buy LBLOCK
- Broker
- Min Deposit
- Score
- Visit Broker

- Award-winning Cryptocurrency trading platform
- $100 minimum deposit,
- FCA & Cysec regulated

- 20% welcome bonus of upto $10,000
- Minimum deposit $100
- Verify your account before the bonus is credited
- Fund Moneta Markets account with a minimum of $250
- Opt in using the form to claim your 50% deposit bonus
Learn to Trade
Never Miss A Trade Again

Signal Notification
Real-time signal notifications whenever a signal is opened, closes or Updated

Get Alerts
Immediate alerts to your email and mobile phone.

Entry Price Levels
Entry price level for every signal Just choose one of our Top Brokers in the list above to get all this free.