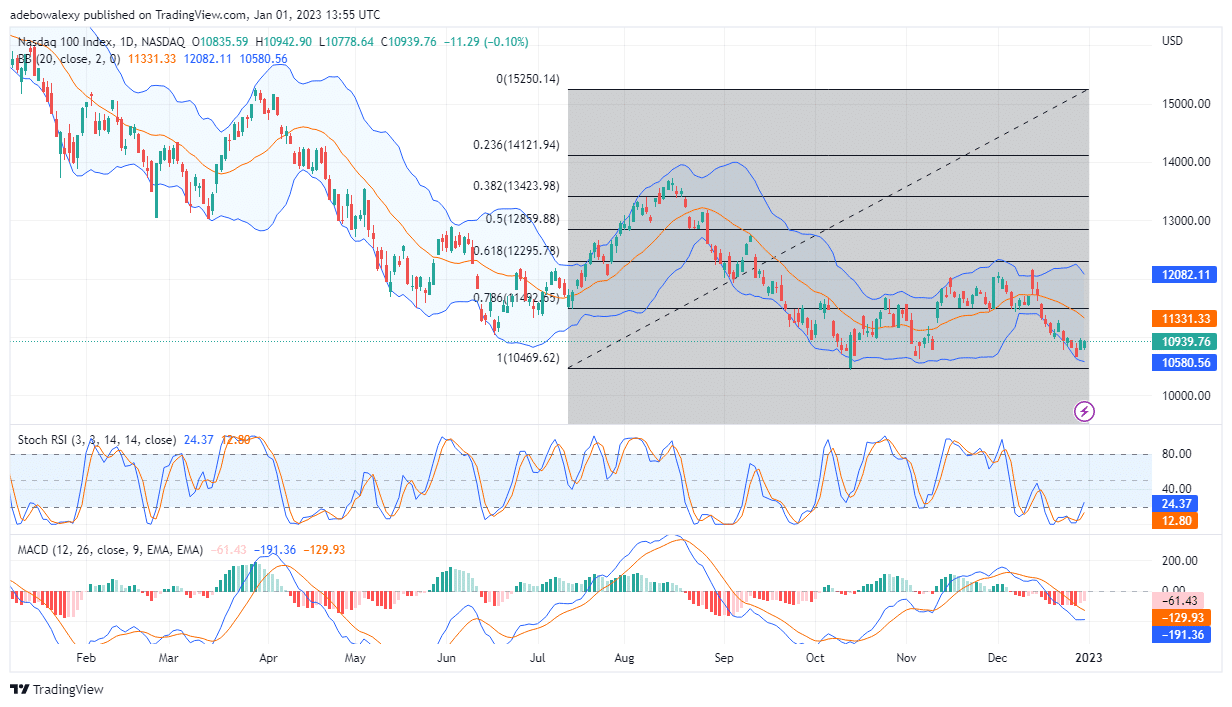
Since nine trading sessions ago, the Nasdaq 100 price action ripped through the Fibonacci support level of 78.60. Currently, price action has rebounded upwards from near $10,600 to $10,939. However, trading indicators continue to point to the possibility of further price increases.
Major Price Levels:
Top Levels: $10,939, $11,000, $11,050
Floor Levels: $10,900, $10,850, $10,800

Nasdaq 100 Ended the Year’s Trading Activities at $10,939.76, Keeps Showing Signs of Possible Future Increases
Price action on the daily Nasdaq 100 market made a moderate recovery, which saw the price increase by roughly $300. However, the final trading sessions of the year 2022 ended in the green, albeit with a few dollar losses, which brought the market price to $10,939.76. Nevertheless, traders can anticipate further gains in this market, as technical indicators continue to indicate an increase in buying momentum. The Stochastic RSI lines are pointing steeply upwards from the oversold levels at 24 and 12 after a crossover. The MACD’s leading curve is also bent sideways, as if attempting a bullish crossover. Also, the histogram bars below the 0.00 point of the MACD indicator are growing rapidly shorter, and are now pale in appearance . The two signs coming from the MACD show that selling momentum is reducing. And, since the price is already rising at this point, traders can expect an increase in buying activity.

Nasdaq 100 May Advance Towards $11,000 in the New Year
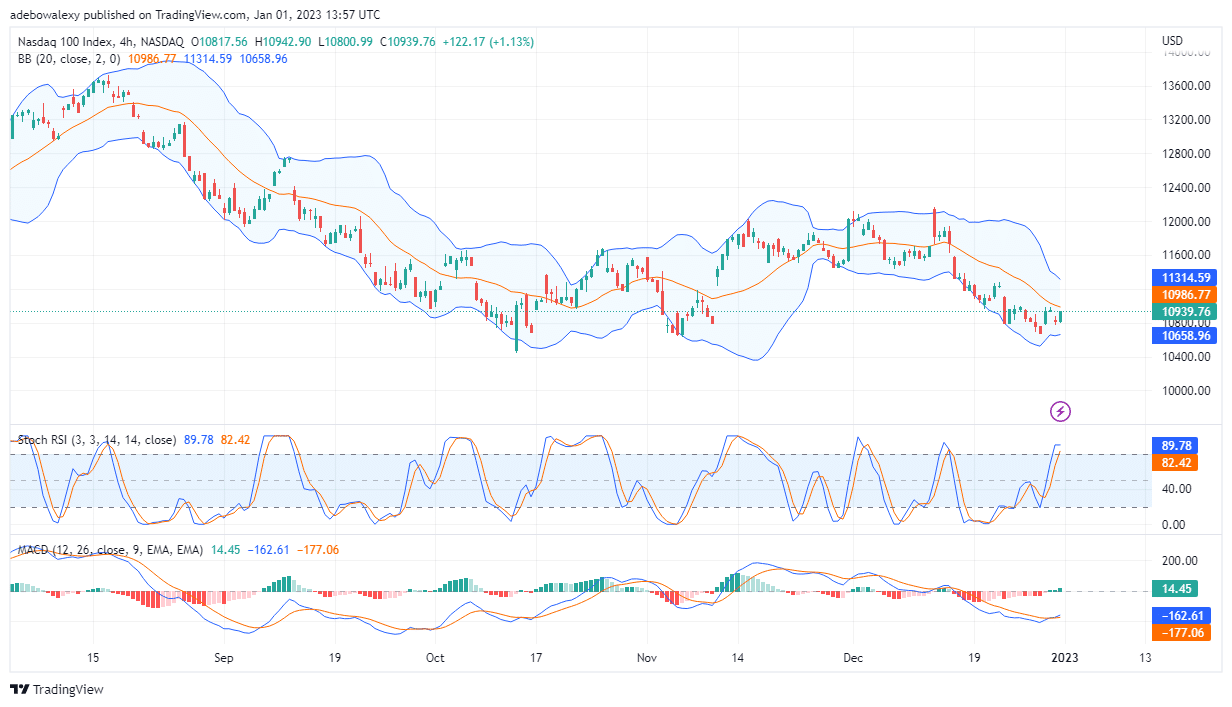
During the closing part of last year’s trading on the Nasdaq 100 4-hour market, buying seems to have been the most dominant move. In addition, trading indicators are mostly aligned to predict that prices may keep increasing. The Stochastic RSI lines have gotten to the overbought region, with the faster line at 89.79 and the slower line at 82.42. However, the leading line of this indicator seems bent sideways for a bearish crossover. Nevertheless, a bearish crossover may not occur given the recent gains witnessed in this market. Also, the MACD lines have just given an upside crossover, and the histogram bars are still growing strong. Consequently, traders can expect this market to keep moving toward the $11,000 price mark once trading starts for the new year.
Do you want to take your trading to the next level? Join the best platform for that here.
- Broker
- Min Deposit
- Score
- Visit Broker
- Award-winning Cryptocurrency trading platform
- $100 minimum deposit,
- FCA & Cysec regulated
- 20% welcome bonus of upto $10,000
- Minimum deposit $100
- Verify your account before the bonus is credited
- Fund Moneta Markets account with a minimum of $250
- Opt in using the form to claim your 50% deposit bonus
Learn to Trade
Never Miss A Trade Again

Signal Notification
Real-time signal notifications whenever a signal is opened, closes or Updated

Get Alerts
Immediate alerts to your email and mobile phone.

Entry Price Levels
Entry price level for every signal Just choose one of our Top Brokers in the list above to get all this free.


