Low volatility in Polygon Market
Polygon (MATICUSD) Price Analysis – 26 December
The price may drop below the $0.76 level and be exposed to the $0.70 and $0.65 levels if the bears’ momentum increases further. In the event that buyers hold onto the $0.76 support level, Polygon will rise and may breach the $0.89 resistance level, which could push the price up to the $0.93 and $1.01 resistance levels.
Key Levels:
Resistance levels: $0.87, $0.93, $1.01
Support levels: $0.76, $0.70, $0.65
MATIC/USD Long-term Trend: Bearish
MATIC/USD price is bearish on the Long-term outlook. The long-term outlook is unfavorable for MATIC/USD pricing. Last two weeks, the Polygon fluctuated between $0.93 and $0.89 levels. The price was forced down to breach the last support level of $0.87 as sellers gained additional traction. On December 16th, the $0.76 support level was tested. It retreated. The market is being dominated by sellers, and the coin is testing the $0.76 support level once more. At the moment, Polygon market is experiencing low volatility.
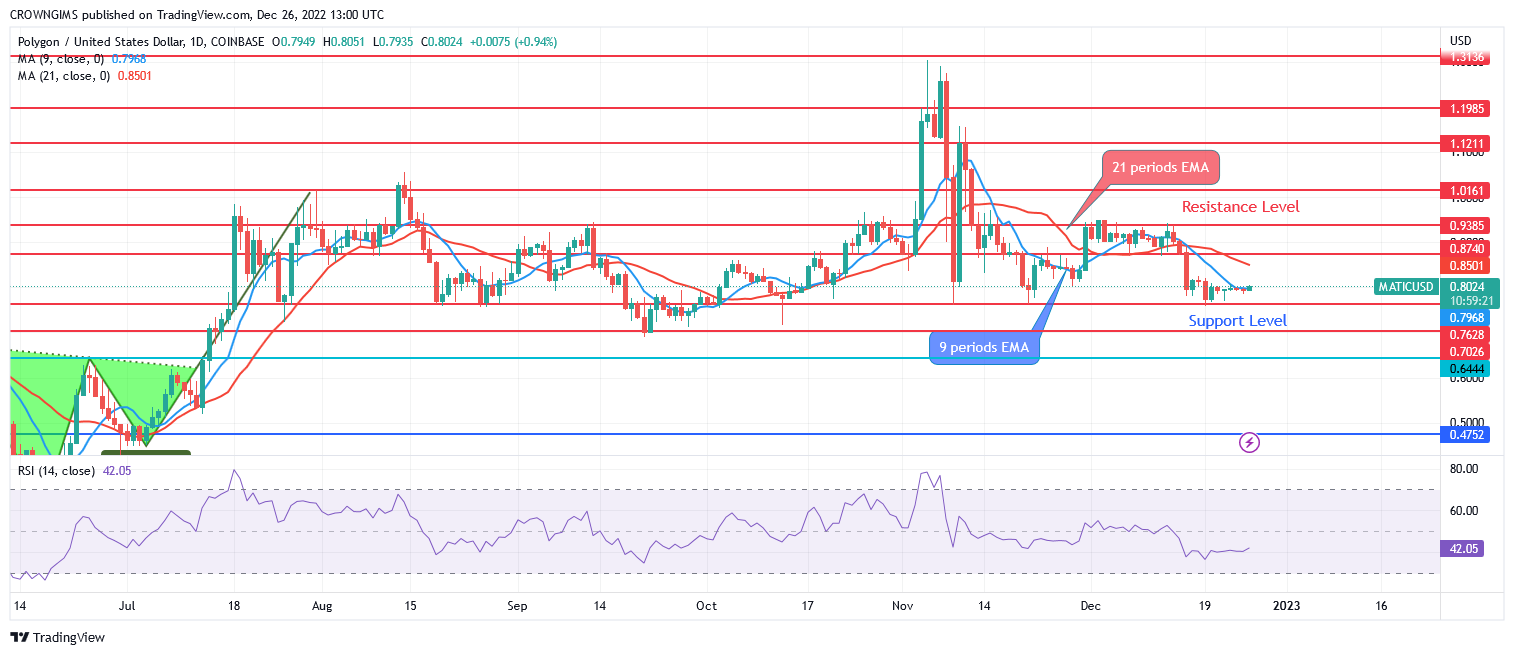
As evidence of a bearish market, MATIC is trading below both the 9- and 21-period exponential moving averages at close contact. The fast-moving average has crossed the slow-moving average downside. The price may drop below the $0.76 level and be exposed to the $0.70 and $0.65 levels if the bears’ momentum increases further. In the event that buyers hold onto the $0.76 support level, Polygon will rise and may breach the $0.89 resistance level, which could push the price up to the $0.93 and $1.01 resistance levels.
MATIC/USD Short-term Trend: Ranging
In the medium run, Polygon is on the ranging movement. The $0.93 price level was maintained a few weeks ago, and the coin was unable to cross it. On December 16, sellers applied extra force to lower the price below the $0.87 support level. Last week, the bears’ power was insufficient to push it below the $0.76 level. Polygon is now ranging within the $0.89 and $0.76 levels.
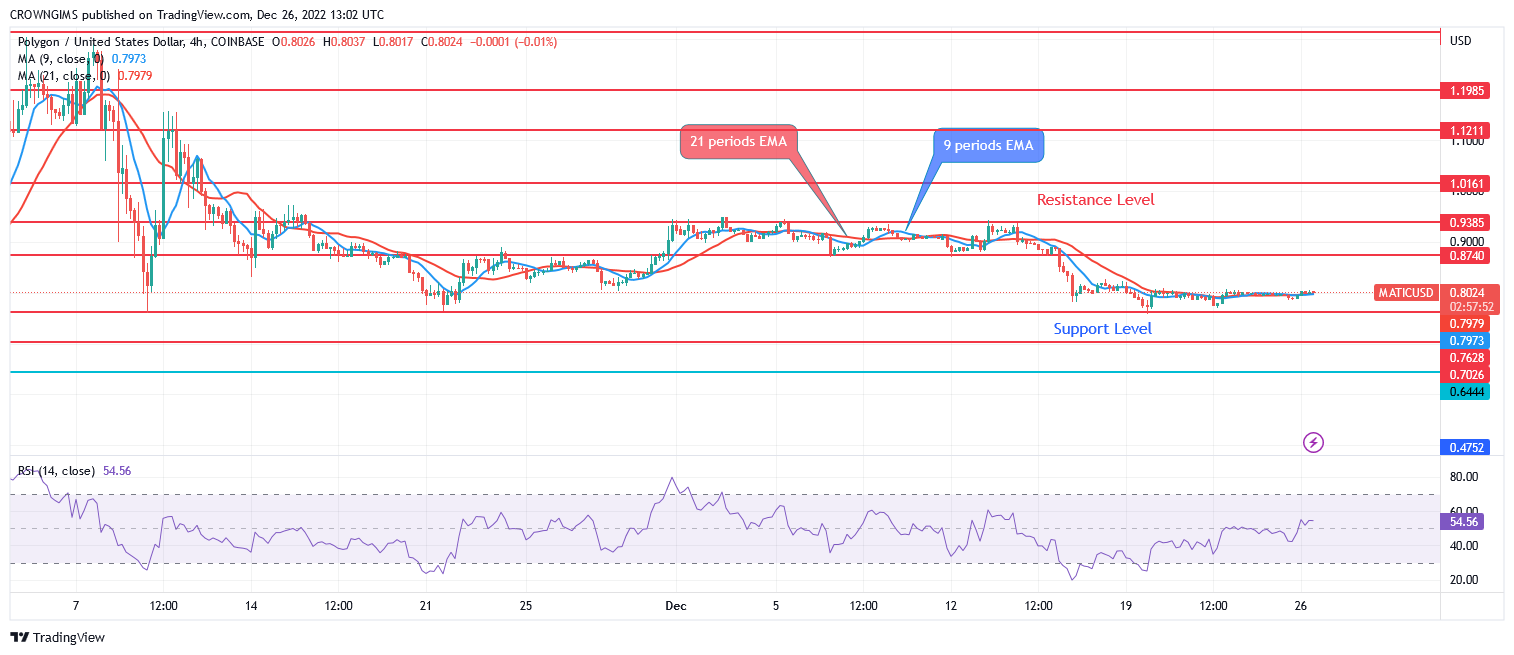
A neutral market is indicated by the Polygon prices trading over and around the two EMAs. The 21-period EMA is interlocked with the 9-day EMA. The signal line on the relative strength index period 14 is not displaying a specific direction at 53 levels.
You can purchase Lucky Block – Guide, Tips & Insights | Learn 2 Trade here. Buy LBLOCK
- Broker
- Min Deposit
- Score
- Visit Broker

- Award-winning Cryptocurrency trading platform
- $100 minimum deposit,
- FCA & Cysec regulated

- 20% welcome bonus of upto $10,000
- Minimum deposit $100
- Verify your account before the bonus is credited
- Fund Moneta Markets account with a minimum of $250
- Opt in using the form to claim your 50% deposit bonus
Learn to Trade
Never Miss A Trade Again

Signal Notification
Real-time signal notifications whenever a signal is opened, closes or Updated

Get Alerts
Immediate alerts to your email and mobile phone.

Entry Price Levels
Entry price level for every signal Just choose one of our Top Brokers in the list above to get all this free.