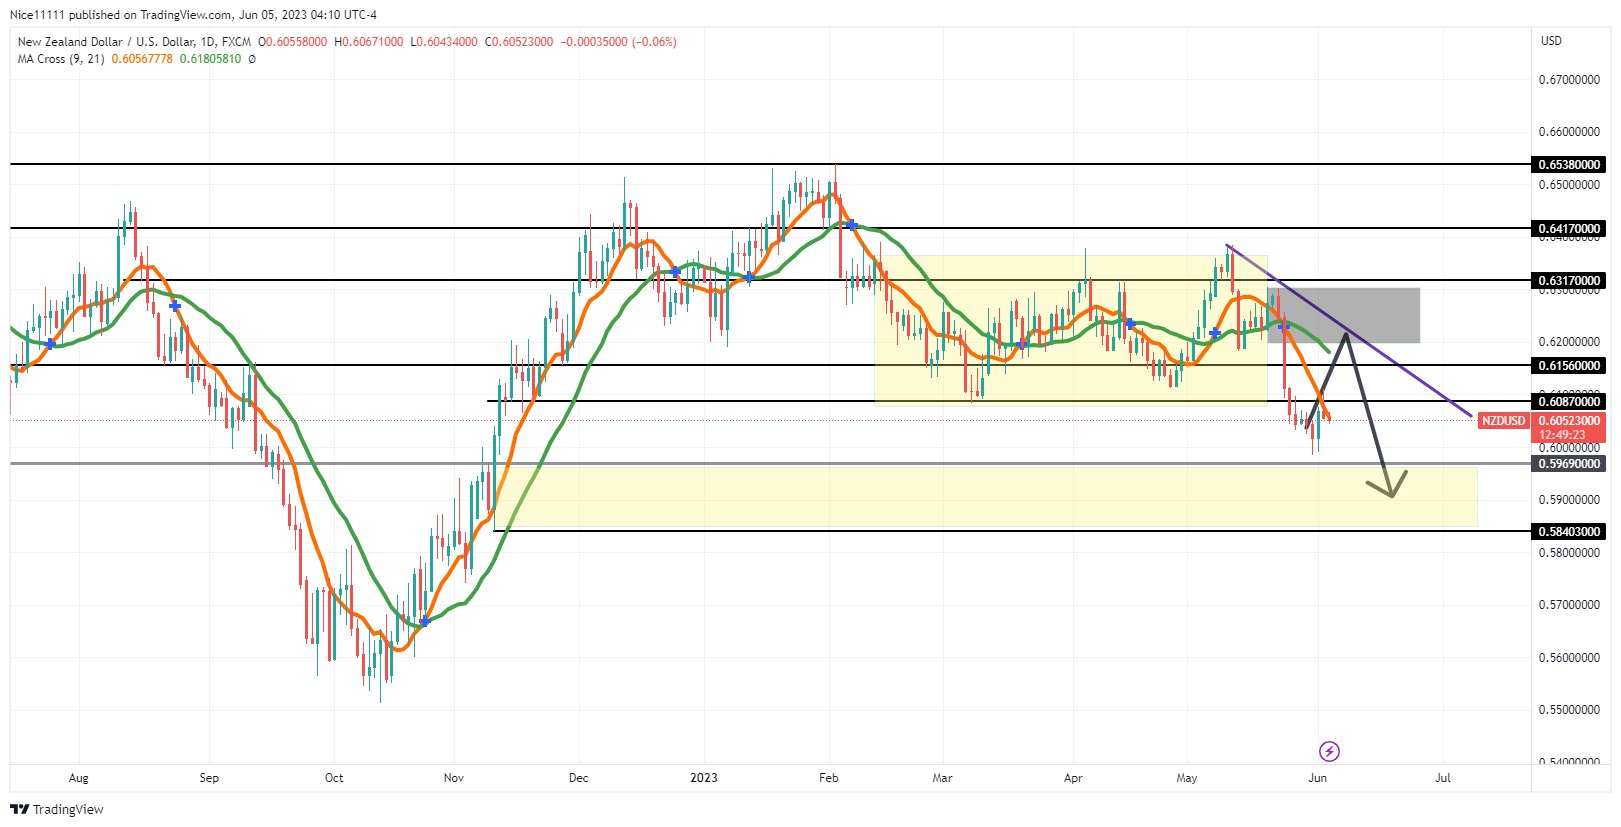
NZDUSD has recently broken free from a consolidation phase. During the months of March and April, the Moving Averages (periods nine and twenty-one) exhibited sideways movement on the body of the daily candles, indicating a lack of clear direction during that period.
The emergence of three black crows signifies the significant selling pressure that propelled the breakout from the consolidation range. Following the last intersection of the Moving Averages, a ranging market results. Presently, the price is descending towards the demand level of 0.5970.
Within the consolidation phase, a bullish order block exists, suggesting a potential retracement. However, considering the magnitude of the sell-off, it is unlikely that a substantial pullback will occur before the price reaches the support level of 0.5950.
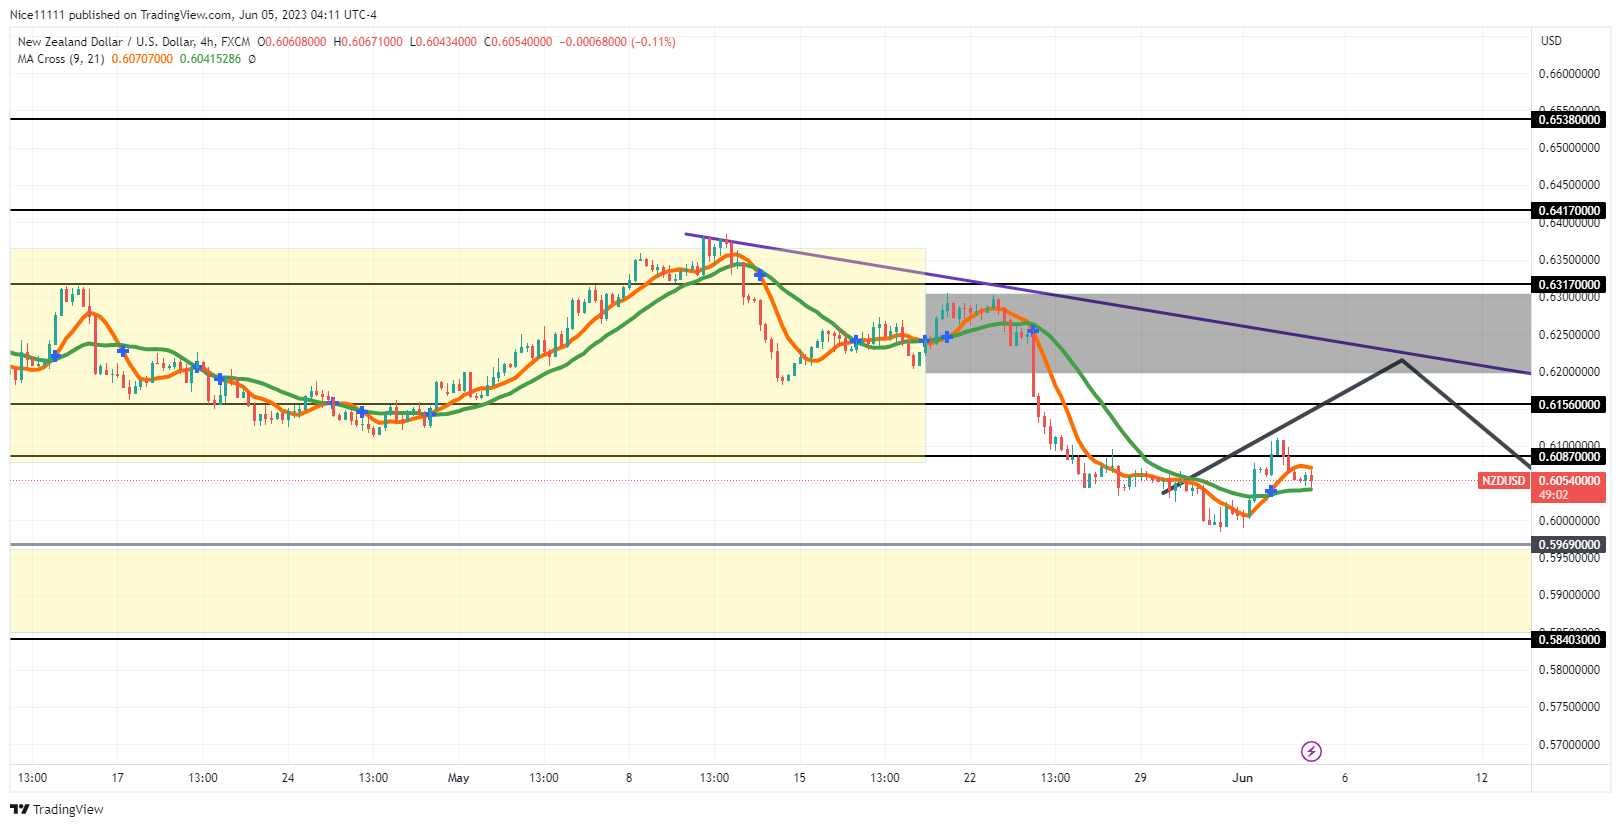
NZDUSD Short-term Trend: Bullish
On the 4-hour chart, the market structure has shifted. The candles have risen above the Moving Averages (periods nine and twenty-one), indicating an uptrend. It is anticipated that the price will experience a pullback towards the identified bullish order block on the daily chart, located above 0.6160, before resuming the overall bearish trend.
Trade on MT4 with Leverage up to 1:500! Trade on MT4 with Leverage up to 1:500!
X
We use cookies to ensure that we give you the best experience on our website. If you continue to use this site we will assume that you are happy with it.