Key Resistance Zones: 14000, 14100, 14200
Key Support Zones: 13400, 13300, 13200
NASDAQ 100 (NAS100) Long-term Trend: Bullish
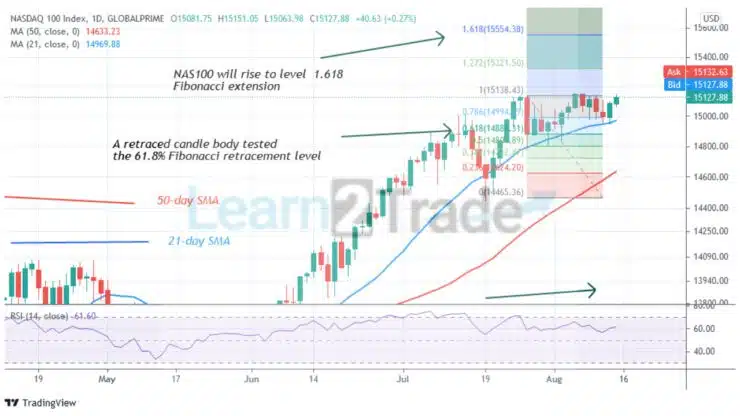
NAS100 is in an upward move. The index trades below the 15200 overhead resistances. Today, buyers are facing rejection at the overhead resistance. Buyers have failed to overcome level 15200 since July. Meanwhile; on July 26 uptrend a retraced candle body tested the 61.8% Fibonacci retracement level. The retracement indicates that NAS100 is likely to rise to level 1.618 Fibonacci extensions or level 15554.80.
Daily Chart Indicators Reading:
The index is at level 60 of the Relative Strength period 14. It indicates that the market is in the bullish trend zone and has room to rally on the upside. The 50-day SMA and the 21-day SMA are sloping upward indicating the uptrend.
NASDAQ 100 (NAS100) Medium-term Trend: Ranging
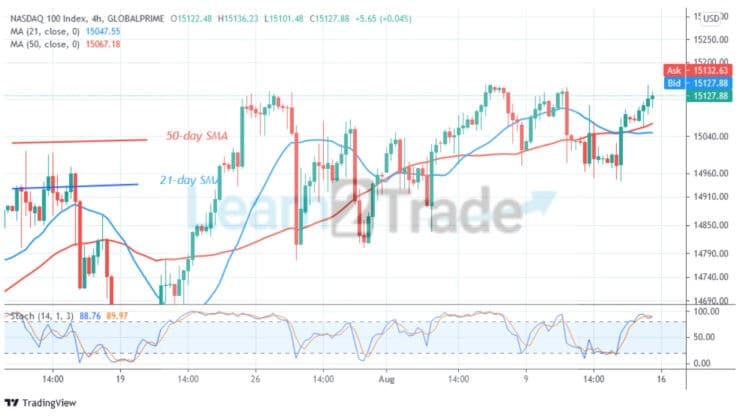
On the 4- hour chart, the index is in a sideways move below level 15200. The index is falling after rejection at level 15200. The downtrend will extend to the low of 14960 if price breaks below the moving averages. In previous price action, NAS100 fell to 14960 after rejection at the overhead resistance.
4-hour Chart Indicators Reading
NASDAQ 100 is below the 80% range of the daily stochastic. The index is in a bearish momentum. The 21-day SMA and the 50-day SMA are sloping horizontally indicating the sideways move.
General Outlook for NASDAQ 100 (NAS100)
The NAS100 index is a range-bound move below level 15200. The bulls are yet to break the resistance as the index falls. Presently, the market is in the overbought region. Sellers have emerged to push prices down. After the downward move, the index will resume its range-bound move.
You can purchase crypto coins here: Buy Tokens
Note: Learn2.Trade is not a financial advisor. Do your research before investing your funds in any financial asset or presented product or event. We are not responsible for your investing results
- Broker
- Min Deposit
- Score
- Visit Broker

- Award-winning Cryptocurrency trading platform
- $100 minimum deposit,
- FCA & Cysec regulated

- 20% welcome bonus of upto $10,000
- Minimum deposit $100
- Verify your account before the bonus is credited
- Fund Moneta Markets account with a minimum of $250
- Opt in using the form to claim your 50% deposit bonus
Learn to Trade
Never Miss A Trade Again

Signal Notification
Real-time signal notifications whenever a signal is opened, closes or Updated

Get Alerts
Immediate alerts to your email and mobile phone.

Entry Price Levels
Entry price level for every signal Just choose one of our Top Brokers in the list above to get all this free.