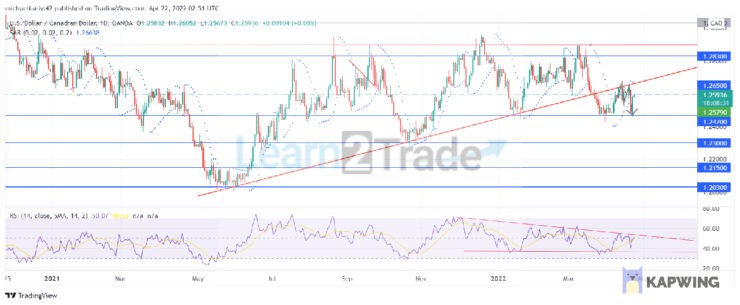
USDCAD breaks to the downside of its triangle pattern under intense pressure from the sellers. While the market kept making consistent higher lows along its uptrend line, it maintained an average of the same highs as it was rejected at the triangle’s upper border. This led to an accumulation of pressure at the lower edge of the triangle. Eventually, USDCAD breaks to the downside of the formation.
USDCAD Key Levels
Resistance Levels: 1.25790, 1.26500 Support Levels: 1.23000, 1.24700
USDCAD Long Term Trend: Bearish
The price caught up in a triangle when it broke through the 1.28300 significant level. It falls lower, violating more key levels till it gets to 1.20300. Though the market pushed to regain lost prices, the sellers set a lid above the market at around 1.28300. This led to the currency pair tapering through the triangle. This ascending triangle formation was meant to go bullish, but pressure from the bears forced it to break downwards.
The price, therefore, breaks downward to 1.24700, from where it rises to retest the lower border of the triangle, after which the market begins to drop again. The RSI (Relative Strength Index) indicator shows a different movement than that of the daily candles. Its lines are tapering through a descending triangle pattern, and the market moves in the direction of the RSI formation to break downward.
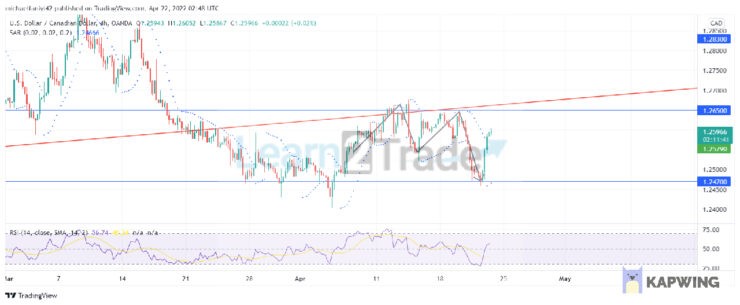
USDCAD Short Term Trend: Bearish
After breaking out of the lower border of the triangle, the price fell to 1.24700, from which it now rallies upward for a retest of the boundary. In so doing, USDCAD creates a double top formation on the 4-hour chart, which has plunged the price to 1.24700. The Parabolic SAR (Stop and Reverse) supports the bearishness of the price. Hence, the market is poised for more downside movement towards 1.23000 after a second retest of the lower border.
Note:Learn2.trade is not a financial advisor. Do your research before investing your funds in any financial asset or presented product or event. We are not responsible for your investing results.
Trade on MT4 with Leverage up to 1:500! Trade on MT4 with Leverage up to 1:500!
X
We use cookies to ensure that we give you the best experience on our website. If you continue to use this site we will assume that you are happy with it.OkPrivacy policy