S&P 500 Price Analysis – April 05
In case the resistance level of $4593 is defended by the bears, price may pullback and face support levels at $44476, $4364 and $4312 levels. An increase in the bulls’ momentum may break up the resistance level of $4593, S&P 500 may increase to $4723 and $4769 levels.
Key levels:
Resistance levels: $4593, $4723, $4769
Support levels: $4476, $4364, $4312
S&P 500 Long-term trend: Bullish
On the weekly chart, S&P 500 is bullish. The price formed a triple bottom chart pattern at the support level of $4169 on March 14. This is a bullish reversal signal and the price obeyed the command. The bulls gained more pressure and push up the price. The former resistance levels at $4364 and $4476 became a support levels. Last week, the resistance level of $4596 was penetrated but the bears disturbed the movement and it pulled back. Today, bulls are returning in to the market and the price may increase further.
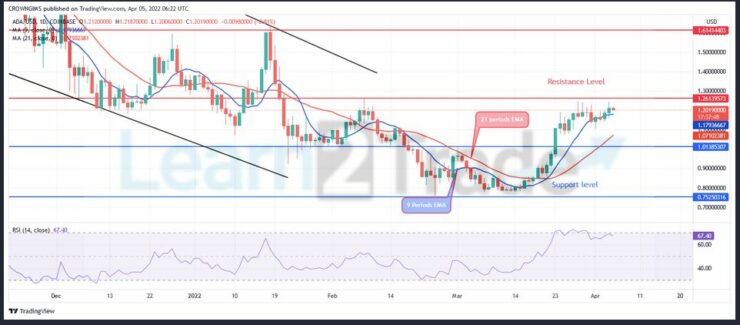
S&P 500 is trading above the 9 periods EMA and the 21 periods EMA which indicate a strong bullish trend in the S&P 500 market. The relative strength index period 14 is at 61 levels with the signal lines pointing up to indicate buy signal. In case the resistance level of $4593 is defended by the bears, price may pullback and face support levels at $44476, $4364 and $4312 levels. An increase in the bulls’ momentum may break up the resistance level of $4593, S&P 500 may increase to $4723 and $4769 levels.
S&P 500 Medium-term Trend: Bullish
S&P 500 is on the bullish trend on the daily chart outlook. When the sellers’ momentum could not break down the support level of $4168. The Triple bottom chart pattern formed at the mentioned level. The bullish movement has placed the price at $4593 level. S&P 500 is trying to exert more pressure to break up just mentioned resistance level.
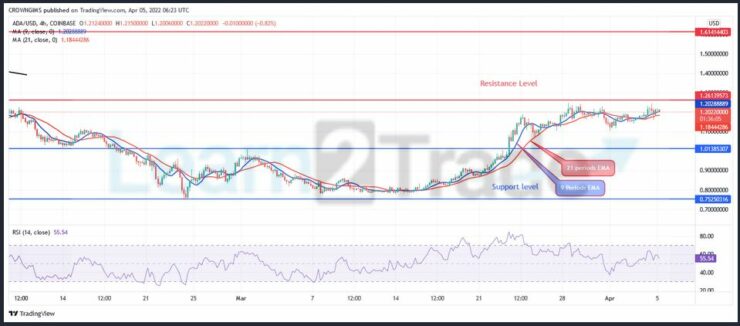
The price is trading above the 9 periods EMA and 21 periods EMA as an indication of bullish movement. The relative strength index period 14 is at 62 levels displaying buy signal.
You can purchase Lucky Block here. Buy LBlock:
- Broker
- Min Deposit
- Score
- Visit Broker

- Award-winning Cryptocurrency trading platform
- $100 minimum deposit,
- FCA & Cysec regulated

- 20% welcome bonus of upto $10,000
- Minimum deposit $100
- Verify your account before the bonus is credited
- Fund Moneta Markets account with a minimum of $250
- Opt in using the form to claim your 50% deposit bonus
Learn to Trade
Never Miss A Trade Again

Signal Notification
Real-time signal notifications whenever a signal is opened, closes or Updated

Get Alerts
Immediate alerts to your email and mobile phone.

Entry Price Levels
Entry price level for every signal Just choose one of our Top Brokers in the list above to get all this free.