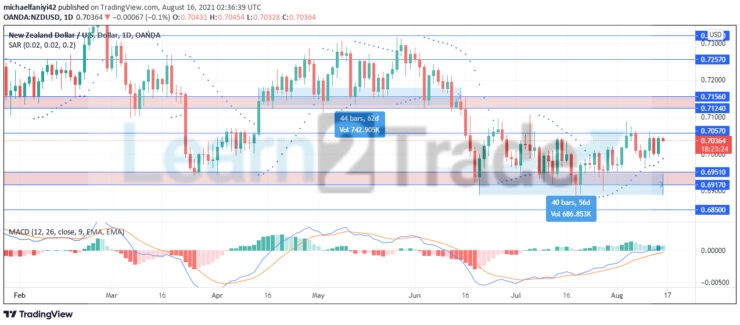
NZDUSD weekly support has stood firm to deny the bears. The market has been primed for a drop, but after several days, the price has been denied the opportunity to go lower. Two major weekly support zones have been responsible for directing the movement of the market – the 0.71560 and the 0.69510 support zones. Price dropped below the 0.71560 support after 43 trading days of persistence in going lower.
NZDUSD Key Level
Resistance Levels: 0.70570, 0.71240 Support Levels: 0.69510, 0.69170
NZDUSD Long Term Trend: Bearish
The market dropped to the 0.69510 support zone with a bearish impulse. While it broke the upper border of the support zone, it didn’t make it past the lower border at 0.69170 before it was repelled. Price bounced up and retested the zone, but it had the same result for the next two consecutive times. On the 20th of July, after bouncing up again, NZDUSD bore down with a force that pierced through the zone, but buyers recovered above the support.
Thereafter, there were two other tests, which were well dealt with by the support. After a total of 40 trading days, the market is now gradually lifting itself back up. The Parabolic SAR (Stop and Reverse) has indicated a direction change since the 26th of July 2021. The MACD (Moving Average Convergence Divergence), however, has its histogram bars reduced despite the price moving upwards. This means there is a convergence of its Moving-Averages lines, which shows an imminent change in direction. Price could test the weekly support again with much greater intensity from this level.
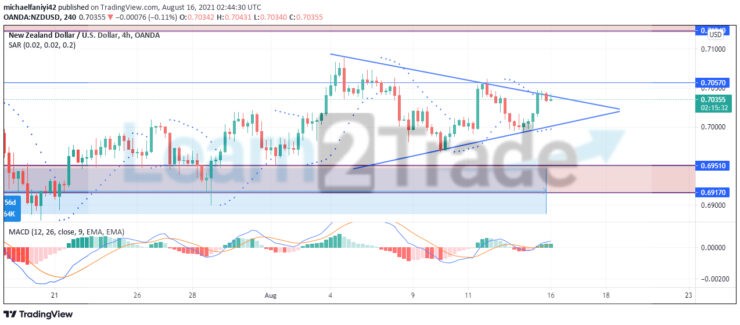
NZDUSD Short Term Trend: Bearish
On the 4-hour chart, the market is tapering down into a symmetrical triangle chart pattern. As price moves closer to the tip of the triangle, there is going to be a breakout, which is most likely to the downward side. Sellers will make use of this pattern to test the 0.69510 weekly support again. The MACD shows undulating reducing bars to show the tapering nature of the market.
NZDUSD will once again test the 0.69510 support zone to break below it to reach 0.68500.
Note:Learn2.trade is not a financial advisor. Do your research before investing your funds in any financial asset or presented product or event. We are not responsible for your investing results.
Trade on MT4 with Leverage up to 1:500! Trade on MT4 with Leverage up to 1:500!
X
We use cookies to ensure that we give you the best experience on our website. If you continue to use this site we will assume that you are happy with it.OkPrivacy policy