Don’t invest unless you’re prepared to lose all the money you invest. This is a high-risk investment and you are unlikely to be protected if something goes wrong. Take 2 minutes to learn more
Cartesi crypto has only experienced an upside price move of about 0.78%. And on the daily chart, price action seems bearish yet. However, we shall study this market for possible upside gains that may offer trading opportunities.
CTSI Analysis Data
Cartesi Value Now: $0.1992
CTSI Market Cap: $145,887,011
CTSI Moving Supply: 732,006,169
Cartesi Total Supply: 1,000,000,000
CTSI CoinMarketCap Ranking: 173
Major Price Levels:
Top: $0.1993, $0.2040, and $0.2083
Base: $0.1953, $0.1913, and $0.1880
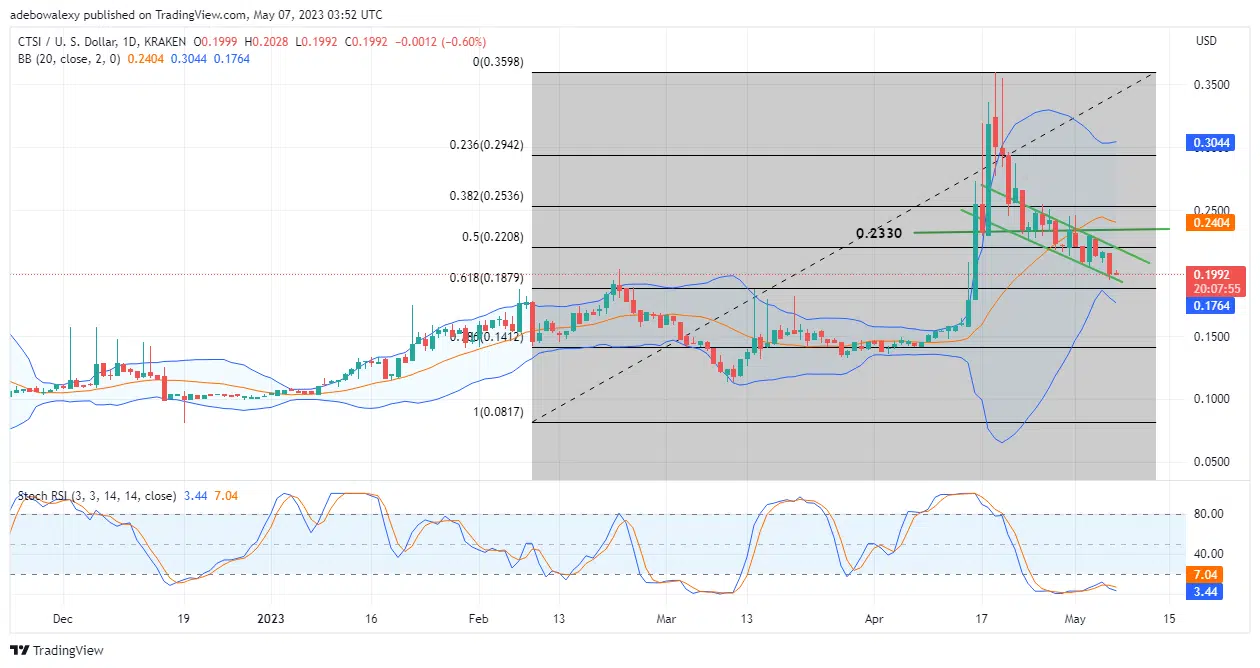
Cartesi Vulnerable Appears Open to Headwind
The Cartesi daily market shows that price action has retraced considerably below the support at $0.2330. Even at that, price action seems generally ready for more. The last price candle here is a red one, which shows that sellers are still making some progress, even with the resistance coming from buyers. Also, the Relative Strength Index (RSI) indicator has returned to its downward path in the oversold zone, after moving just a few inches upward. Consequently, this suggests that price action may move further downward at the supply level.
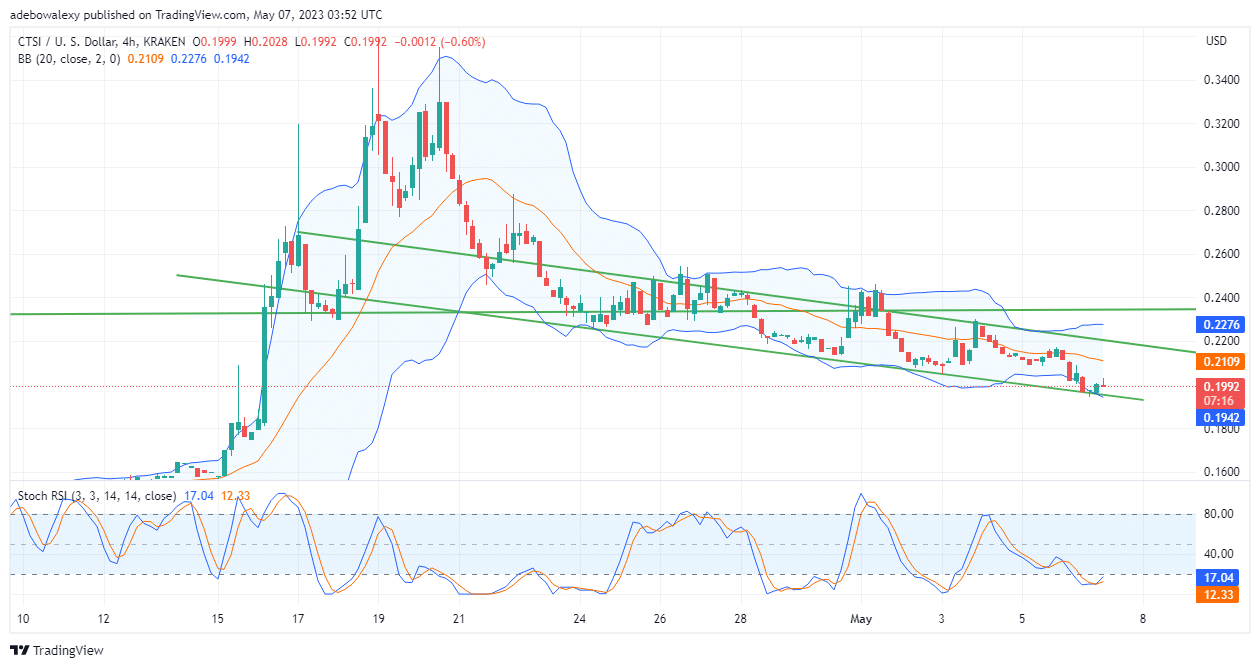
Cartesi Price Action Upside Attempt May Not Be Strong Enough
Price activities on the Cartesi 4-hour market reveal that buyers have been trying to cause an upside retracement. However, the last price candlestick on this time frame suggests that this retracement is already being met by opposition. An inverted hammer price candlestick has just appeared on this chart. Meanwhile, the Stochastic (RSI) indicator seems affected by such a minor retracement, as portrayed by the last price candle. Furthermore, these lines are still at the initial stage of an upside crossover, and below the 20 level of the indicator. This points out that downward forces may be strong and the price may fall towards the $0.1990 price level.
- Broker
- Min Deposit
- Score
- Visit Broker

- Award-winning Cryptocurrency trading platform
- $100 minimum deposit,
- FCA & Cysec regulated

- 20% welcome bonus of upto $10,000
- Minimum deposit $100
- Verify your account before the bonus is credited
- Fund Moneta Markets account with a minimum of $250
- Opt in using the form to claim your 50% deposit bonus
Learn to Trade
Never Miss A Trade Again

Signal Notification
Real-time signal notifications whenever a signal is opened, closes or Updated

Get Alerts
Immediate alerts to your email and mobile phone.

Entry Price Levels
Entry price level for every signal Just choose one of our Top Brokers in the list above to get all this free.