STELLAR Price Analysis – July 13
When the bears’ pressure unable to break down the support level of $0.09, the price may increase towards the $0.11, $0.13 and $0.16 resistance levels. In case the bears further increase their momentum, it may reach and break down the support level of $0.09, below it are $0.07 and $0.05 support levels.
Key Levels:
Resistance levels: $0.11, $0.13, $0.16
Support levels: $0.09, $0.07, $0.05
XLM/USD Long-term Trend: Bearish
Stellar is on the bearish movement in the daily chart. The pressure from the bears increase as more bearish candles emerge. Last week, the price pulled back when double bottom chart pattern formation could not hold. It decreases toward the support level of $0.09, it has not reached the mark before bulls opposed the movement. However, the price is heading towards the support level of $0.09 at the moment.
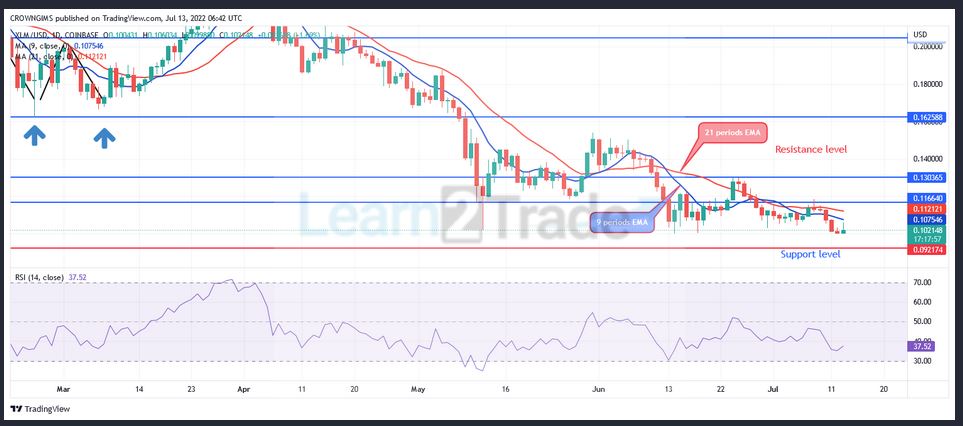
Stellar is trading below the 9 periods EMA and 21 periods EMA with the two EMAs separated from each other. There is an indication of an increase in the bears’ momentum. When the bears’ pressure unable to break down the support level of $0.09, price may increase towards the $0.11, $0.13 and $0.16 resistance levels. In case the bears further increase their momentum, it may reach and break down the support level of $0.09, below it, are $0.07 and $0.05 support levels. However, the relative strength index period 14 is bending down at 40 levels to indicate sell signal.
XLM/USD Medium-term Trend: Bearish
XLM is on the bearish movement on the 4-hour chart. The bears dominate the Stellar market after the ranging movement on 4-hour chart. The price was on the bearish movement. The bears’ momentum later increased and the price decreased and tested $0.09 support level. The bulls’ momentum opposed the bears and the price pulled back towards the resistance level of $0.13. Presently, it is heading towards $0.092 level.
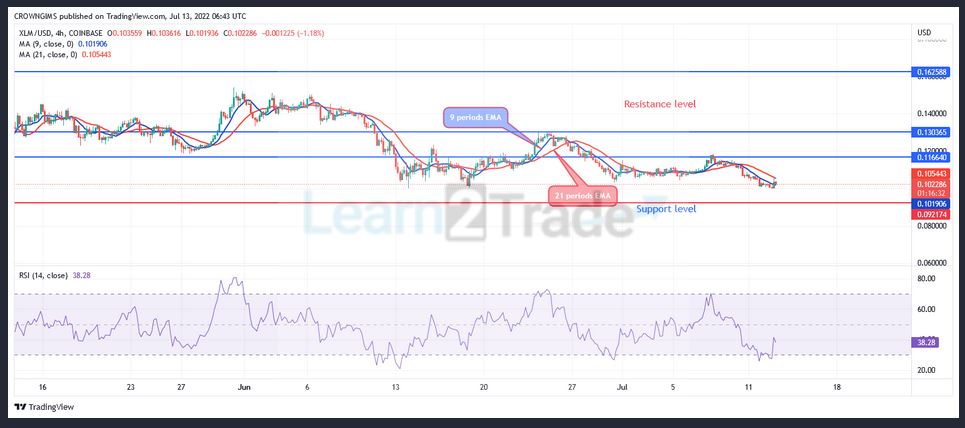
The price is trading below the 9 periods EMA and the 21 periods EMA at close contact as a sign of weak bearish movement. The Relative Strength Index period 14 is at 38 levels displaying a bullish direction,
You can purchase crypto coins here: Buy LBlock
- Broker
- Min Deposit
- Score
- Visit Broker

- Award-winning Cryptocurrency trading platform
- $100 minimum deposit,
- FCA & Cysec regulated

- 20% welcome bonus of upto $10,000
- Minimum deposit $100
- Verify your account before the bonus is credited
- Fund Moneta Markets account with a minimum of $250
- Opt in using the form to claim your 50% deposit bonus
Learn to Trade
Never Miss A Trade Again

Signal Notification
Real-time signal notifications whenever a signal is opened, closes or Updated

Get Alerts
Immediate alerts to your email and mobile phone.

Entry Price Levels
Entry price level for every signal Just choose one of our Top Brokers in the list above to get all this free.