STELLAR Price Analysis – August 25
The bulls may push the price down to the $0.30 level and may penetrate it, if this happen, price declination to $0.22 and $0.16 support levels is possible. Failure to break down $0.30 level may lead to ranging movement, resistance levels above current price can be found at $0.42, $0.50 and $0.57.
XLM/USD Market
Key Levels:
Resistance levels: $0.41, $0.50, $0.57
Support levels: $0.30, $0.22, $0.16
XLM/USD Long-term Trend: Bearish
Stellar is on the bearish movement on the daily chart. The crypto was under the control of the bulls for more than two weeks. The bullish momentum pushes the price to the resistance level at $0.41. The bulls’ pressure failed and the price retraced towards the $0.30 level. On August 24 a strong bearish candle appeared and engulfs the previous daily candle. Stellar decreases and penetrate the dynamic support levels.
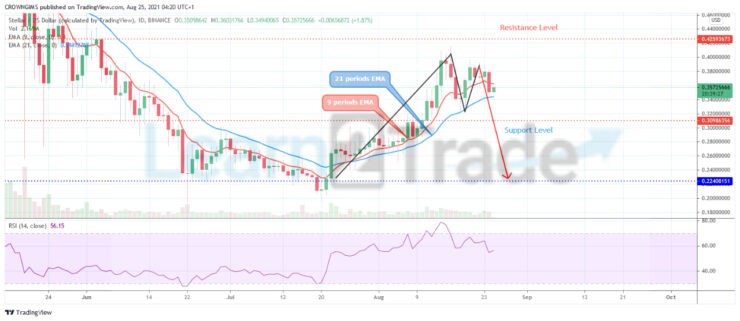
Stellar is trying to break down the dynamic support levels. Stellar is trading between the 9 periods EMA and 21 periods EMA as a symbol of bearish movement. The bulls may push the price down to the $0.30 level and may penetrate it, if this happen, price declination to $0.22 and $0.16 support levels is possible. Failure to break down $0.30 level may lead to ranging movement, resistance levels above current price can be found at $0.42, $0.50 and $0.57.
XLM/USD Medium-term Trend: Bearish
Stellar is bearish on the 4-hour chart. Stellar hits the resistance level of $0.42 on August 10. The bulls’ momentum could not break up the mentioned level. It pulled back towards the broken level and made the second attempt of breakout at $0.42. The price action on the 4-hour chart has formed a short “M” chart pattern. There is tendency for the price to fall.
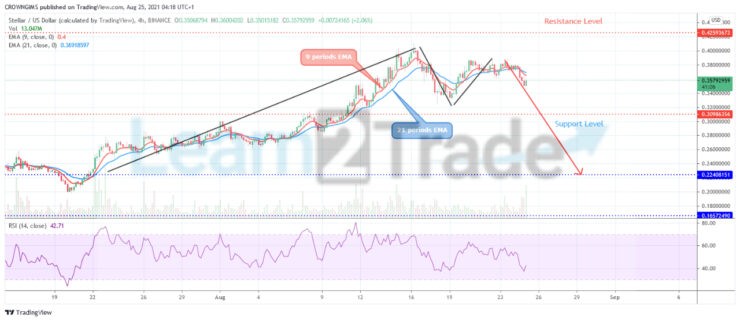
Stellar is trading below 9 periods EMA and 21 periods EMA. The Relative Strength Index periods 14 is at 40 levels and the signal line pointing down to indicate a sell signal.
You can purchase crypto coins here. Buy Tokens
- Broker
- Min Deposit
- Score
- Visit Broker

- Award-winning Cryptocurrency trading platform
- $100 minimum deposit,
- FCA & Cysec regulated

- 20% welcome bonus of upto $10,000
- Minimum deposit $100
- Verify your account before the bonus is credited
- Fund Moneta Markets account with a minimum of $250
- Opt in using the form to claim your 50% deposit bonus
Learn to Trade
Never Miss A Trade Again

Signal Notification
Real-time signal notifications whenever a signal is opened, closes or Updated

Get Alerts
Immediate alerts to your email and mobile phone.

Entry Price Levels
Entry price level for every signal Just choose one of our Top Brokers in the list above to get all this free.