NZDUSD Analysis – June 6
NZDUSD selling pressure increased significantly after a bearish order block was tested on the 20th of April. The bearish order block rested at 0.6810. The market crashed for the next three weeks after the test of the bearish order block. There were only two bullish days on the 4th and 11th of May during the bearish trend.
NZDUSD Key zones
Resistance Zones: 0.6810, 0.6550
Support Zones: 0.6200, 0.6710
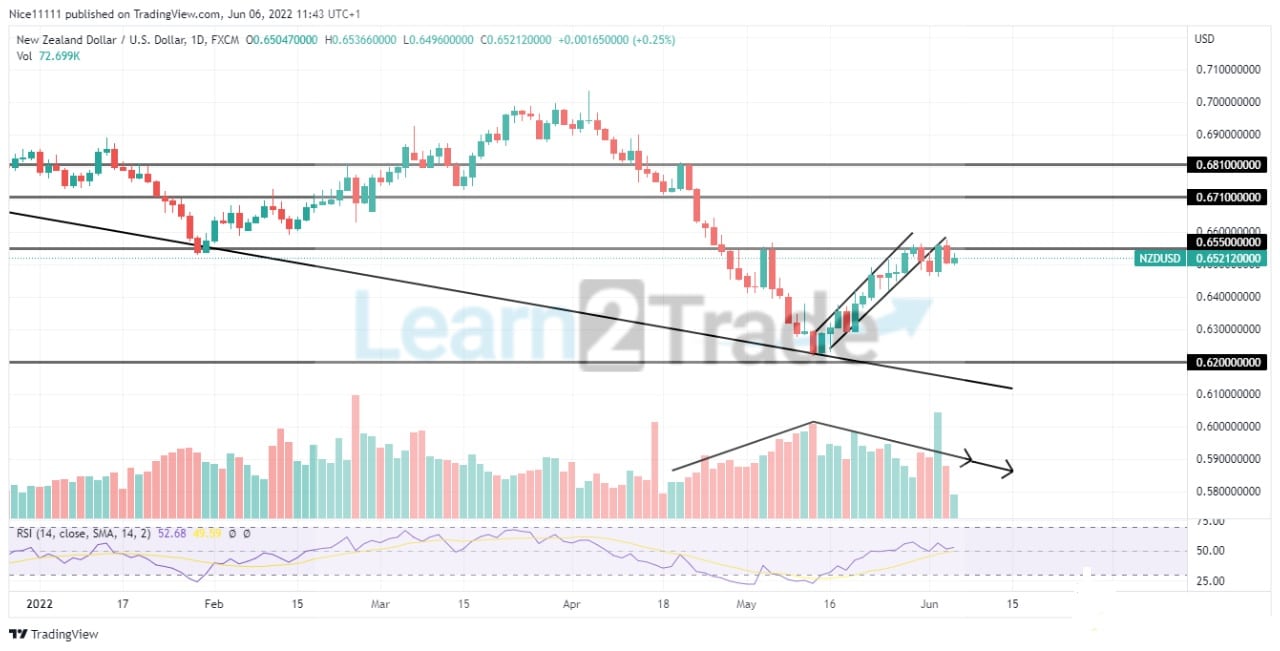
NZDUSD Long Term Trend: Bearish
The sell-off that occurred on the 21st of April resulted in invalidating the lows formed on the 31st of January. The volume indicator revealed a consistent increase in market orders since the 20th of April. The volume indicator peaked on the 12th of May. The 12th of May was the last day of the bearish trend as the market reached the demand level at 0.6200.
The RSI (Relative Strength Indicator) revealed that the market was oversold on the 12th of May as the market reached the demand zone at 0.6200. Ever since the demand zone was struck, the market’s orders have experienced a continuous drop, as seen on the volume indicator. The Relative Strength Index reveals that the market is currently bullish. The market ascended to the daily low on the 31st of January.
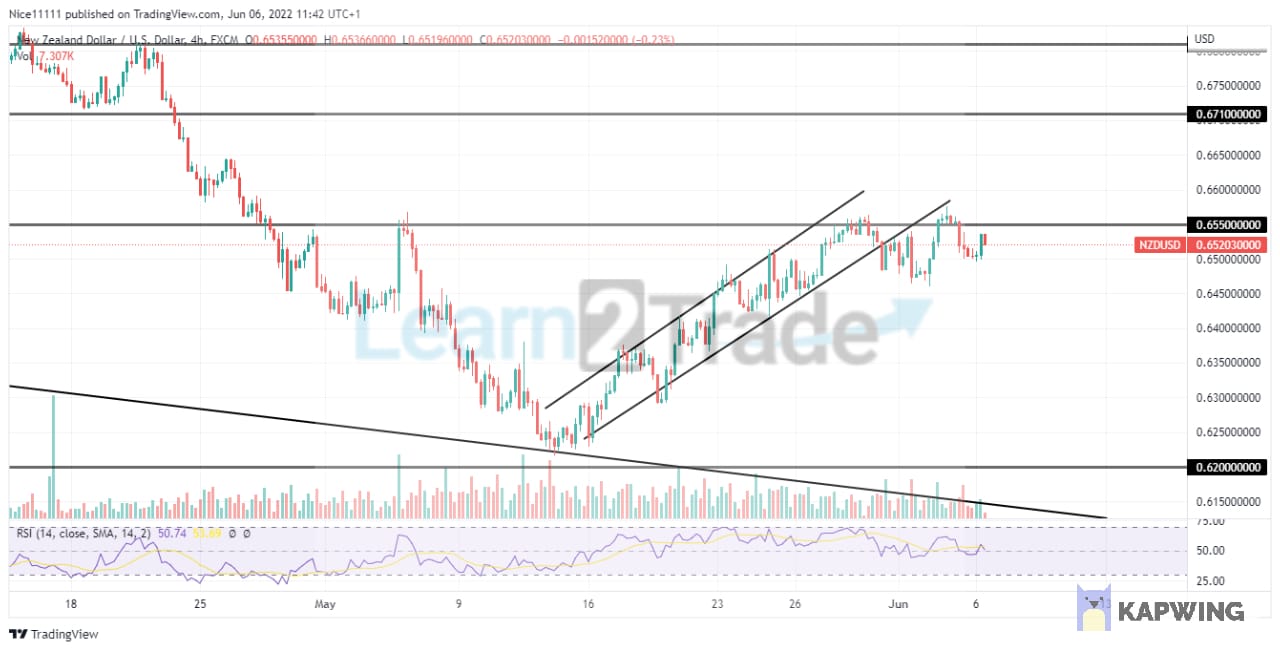
NZDUSD Short Term Trend: Bearish
The market reached 0.6550 on the 30th of May. The bulls are currently facing resistance at 0.6550. The market ascended through a bullish channel to get to the resistance level. There is an obvious breakout of the ascending channel on the four-hour chart. This has also been a retest followed by the breakout of the parallel channel. The market is likely to resume its bearish trend. The lower time frame breakout on the higher time frame resistance level will likely transcend a bearish market shift on the daily chart. The bears are expected to drive towards the previous demand level at $0.6200 to continue the bearish trend.
How To Buy Lucky Block
Note: Learn2.trade is not a financial advisor. Do your research before investing your funds in any financial asset or presented product or event. We are not responsible for your investing results
- Broker
- Min Deposit
- Score
- Visit Broker

- Award-winning Cryptocurrency trading platform
- $100 minimum deposit,
- FCA & Cysec regulated

- 20% welcome bonus of upto $10,000
- Minimum deposit $100
- Verify your account before the bonus is credited
- Fund Moneta Markets account with a minimum of $250
- Opt in using the form to claim your 50% deposit bonus
Learn to Trade
Never Miss A Trade Again

Signal Notification
Real-time signal notifications whenever a signal is opened, closes or Updated

Get Alerts
Immediate alerts to your email and mobile phone.

Entry Price Levels
Entry price level for every signal Just choose one of our Top Brokers in the list above to get all this free.