CELO/USDT price movements stay mostly flat after recovering above the Fibonacci level of 61.80. In addition, trading indicators appear to still be indicating some positivity in this market. What are the chances of these positive signs developing further? Let’s check it out.
CELO Analysis Data
CELO Value Now: $0.609
Celo Market Cap: $299,861,291
Celo Moving Supply: 494,976,084
CELO Total Supply: 1,000,000,000
Celo CoinMarketCap Ranking: 119
Major Price Levels:
Top: $0.629, $0.660, and $0.700
Base: $0.609, $0.580, and $0.560

Celo Price Action Is Ranging
Price activity in the CELO/USDT market is generally sideways. At this point, price action seems to have lost volatility for about 3 sessions. However, the Stochastic Relative Strength Index (RSI) lines are still projected upwards, with reduced distance between the leading and lagging lines. Similarly, the Moving Average Convergence Divergence (MACD) indicator lines seem to have changed bearing from a downward path to a sideways one. Also, the histogram bars of the MACD are pale red and growing short. These signs appear to be hinting that price action in this market can still gain bullish momentum.
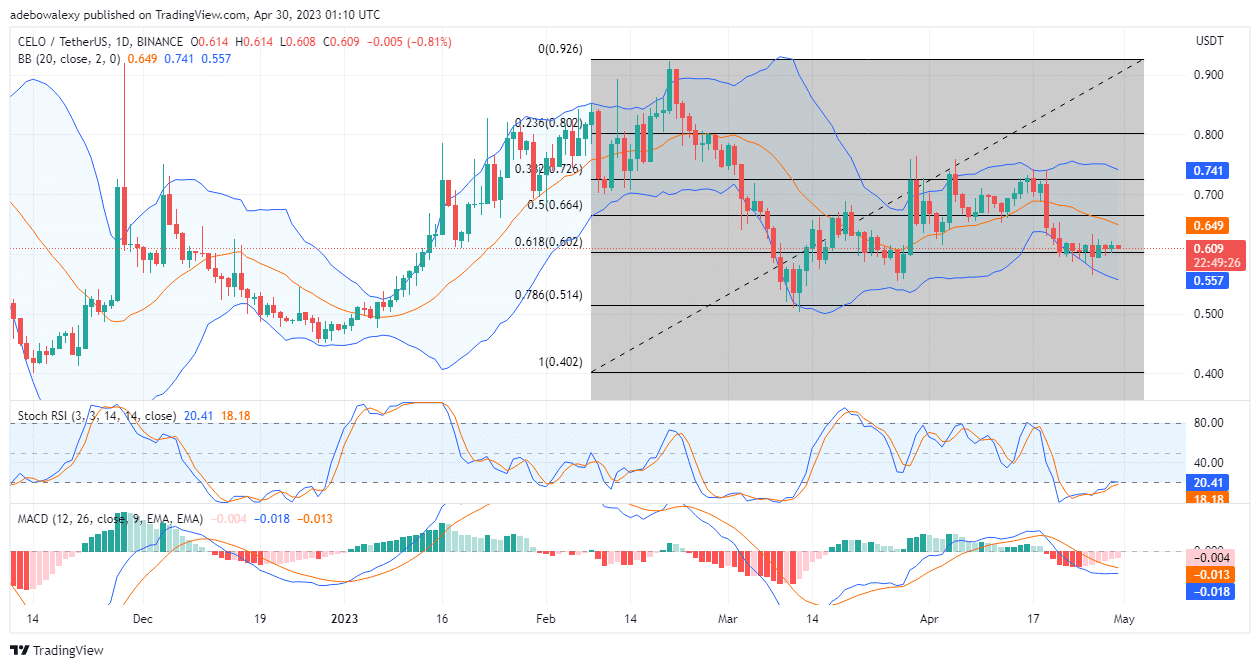
It Appears That Bulls Are Quietly Gaining Momentum in the CELO/USDT Market
Trading indicators on the CELO/USDT market present mixed indications. Here, price action is above the Moving Average (MA) line of the used Bollinger Bands indicator. Although the last red price candle has touched down on the MA, the MACD lines remain slightly upward-oriented. Also, the MACD bars above the 0.00 point have now turned pale green. Meanwhile, the Stochastic RSI curves have just delivered a bearish crossover in the overbought zone. Nevertheless, the Bolinger Bands can be seen contracting, which suggests that a price move is developing. Although most of the signs presented on this market suggest a downward retracement, traders can still anticipate an upside retracement towards 0.625.
- Broker
- Min Deposit
- Score
- Visit Broker

- Award-winning Cryptocurrency trading platform
- $100 minimum deposit,
- FCA & Cysec regulated

- 20% welcome bonus of upto $10,000
- Minimum deposit $100
- Verify your account before the bonus is credited
- Fund Moneta Markets account with a minimum of $250
- Opt in using the form to claim your 50% deposit bonus
Learn to Trade
Never Miss A Trade Again

Signal Notification
Real-time signal notifications whenever a signal is opened, closes or Updated

Get Alerts
Immediate alerts to your email and mobile phone.

Entry Price Levels
Entry price level for every signal Just choose one of our Top Brokers in the list above to get all this free.