Sellers’ and Buyers’ momentum is low
AUDUSD Price Analysis – 29 March
In case sellers are successful in holding the $0.66 resistance level, price may decline below the $0.65, $0.63, and $0.62 support levels. The resistance level of $0.66 may be broken higher when buyers gain more traction, and the price may then rise as a result of the upward momentum to levels of $0.68 and $0.70.
AUD/USD Market
Key levels:
Resistance levels: $0.66, $0.68, $0.70
Support levels: $0.65, $0.63, $0.62
AUDUSD Long-term Trend: Bearish
AUDUSD is on a bearish movement in the daily chart. On February 2nd, the $0.71 resistance level was tested. At the same level as before, the small Double Top chart pattern is visible. This might indicate that market bears are getting agitated. Price increased past the previously noted strong resistance level before declining. After dropping below recent support levels of $0.68 and $0.66, the price is now aiming for $0.65.
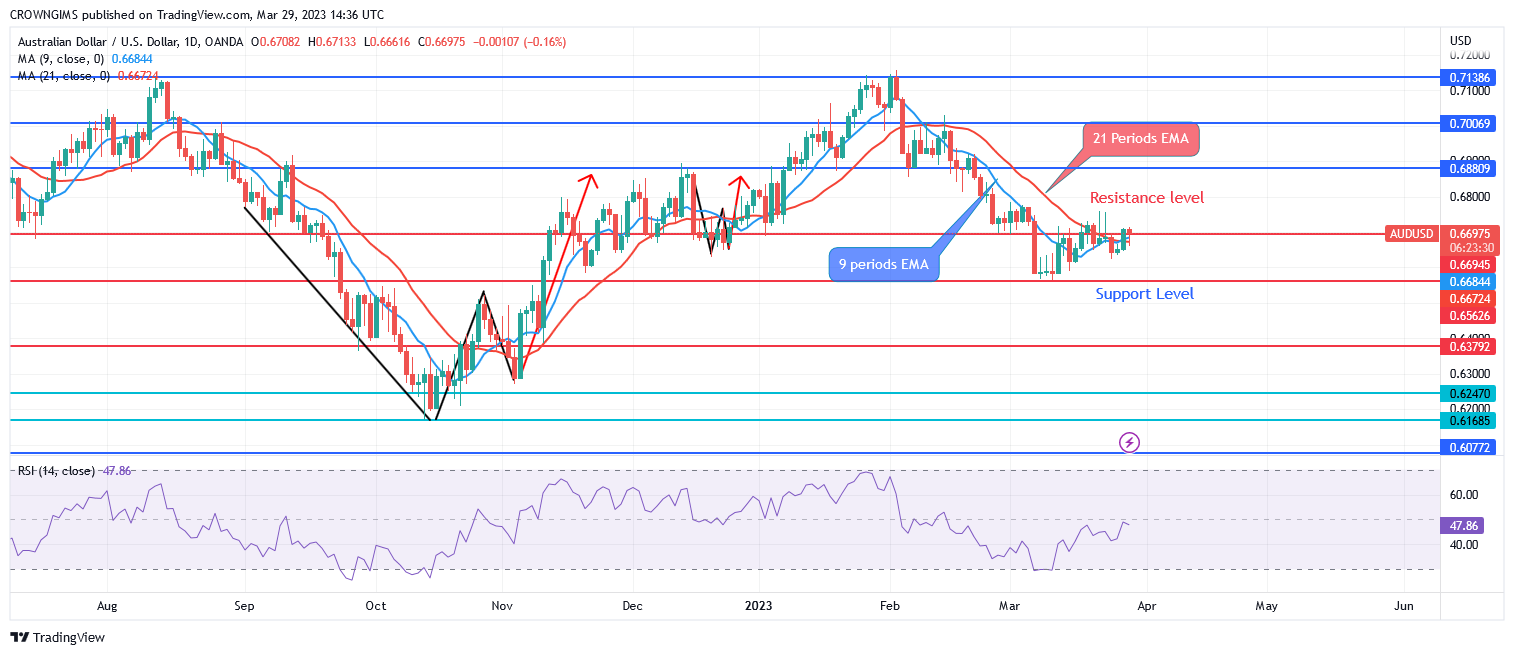
At the moment, the currency pair is trading around the 9-period and 21-period exponential moving averages, pointing to a bearish trend. In case sellers are successful in holding the $0.66 resistance level, price may decline below the $0.65, $0.63, and $0.62 support levels. The resistance level of $0.66 may be broken higher when buyers gain more traction, and the price may then rise as a result of the upward momentum to levels of $0.68 and $0.70.
AUDUSD medium-term Trend: Bearish
AUDUSD is bearish on the 4-hour chart. Due to the price’s strong upward trajectory, it was necessary to attempt to break past the $0.71 barrier level on January 26. In an endeavor to hold the $0.70 support level, it declined. Increased buyer pressure caused the price to test the prior high at $0.71 the next day, which resulted in the formation of the double-top chart pattern. After falling below the $0.66 and $0.68 support levels, it started a ranging movement.
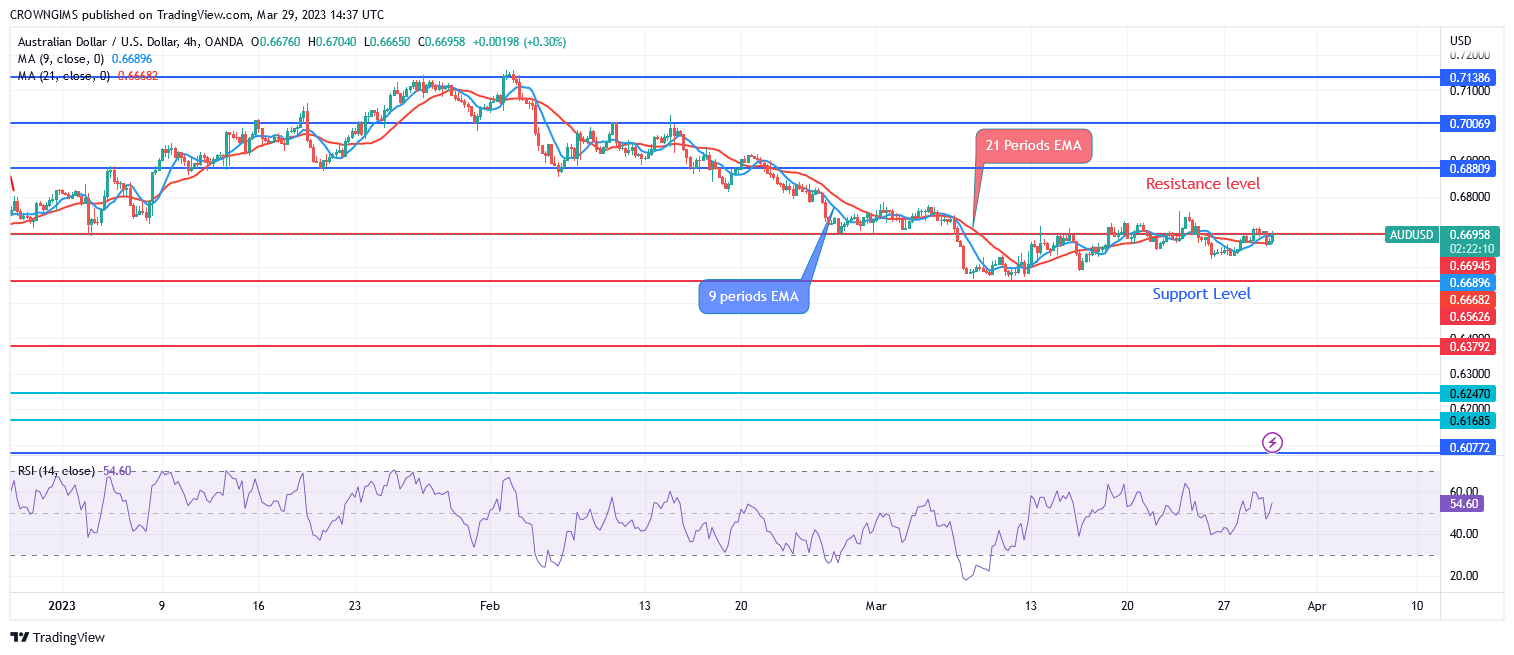
AUDUSD is trading around the 9-period and 21-period exponential moving averages. Relative Strength Index period 14 pointing to 51 levels, signal lines indicate a buy signal.
You can purchase Lucky Block here. Buy LBLOCK
- Broker
- Min Deposit
- Score
- Visit Broker

- Award-winning Cryptocurrency trading platform
- $100 minimum deposit,
- FCA & Cysec regulated

- 20% welcome bonus of upto $10,000
- Minimum deposit $100
- Verify your account before the bonus is credited
- Fund Moneta Markets account with a minimum of $250
- Opt in using the form to claim your 50% deposit bonus
Learn to Trade
Never Miss A Trade Again

Signal Notification
Real-time signal notifications whenever a signal is opened, closes or Updated

Get Alerts
Immediate alerts to your email and mobile phone.

Entry Price Levels
Entry price level for every signal Just choose one of our Top Brokers in the list above to get all this free.