Don’t invest unless you’re prepared to lose all the money you invest. This is a high-risk investment and you are unlikely to be protected if something goes wrong. Take 2 minutes to learn more
AMP/USD price action moved up by 2.74% today. However, for what it’s worth, price action in this market still looks more bearish. And it appears as if the price may fall even further.
AMP Analysis Data:
Amp value now: $0.004530
Amp market cap: $191.92 million
AMP moving supply: 42.23 billion
Amp Total Supply: 99.22 billion
AMP Coinmarketcap ranking: #150
Major Price Levels:
Top: $0.004535, $0.004565, $0.004600
Base: $0.004530, $0.004470, $0.004450
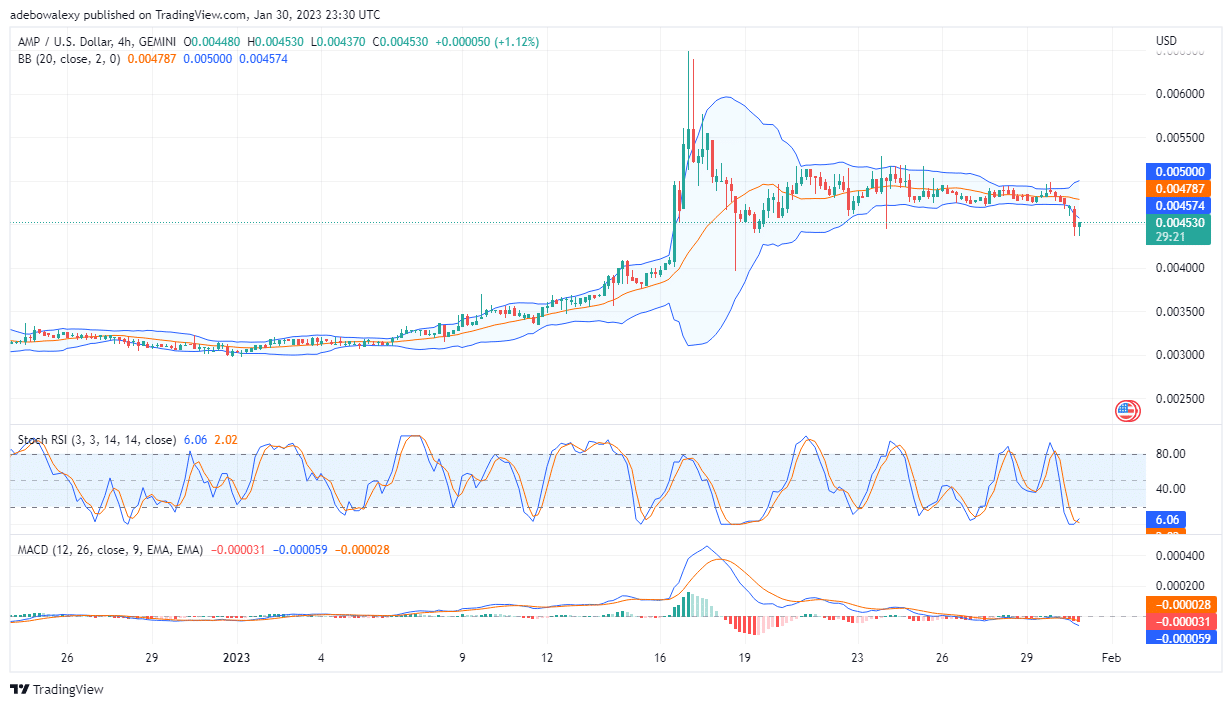
AMP/USD Still Appears More Bearish
The price action in the AMP/USD market looks poised for more downward movement. The last price candle on this chart has pushed prices under the MA line. Meanwhile, the line of the RSI indicator keeps dragging at the lowest point in the oversold region, consequently, this portrays a lack of upside momentum. Likewise, the MACD has recently performed a bearish crossover above the 0.00 level of the indicator. Additionally, the histogram bars of this indicator are now growing red to reveal that the downward forces are increasing in momentum. Therefore, traders should prepare for a further decrease in AMP’s price.
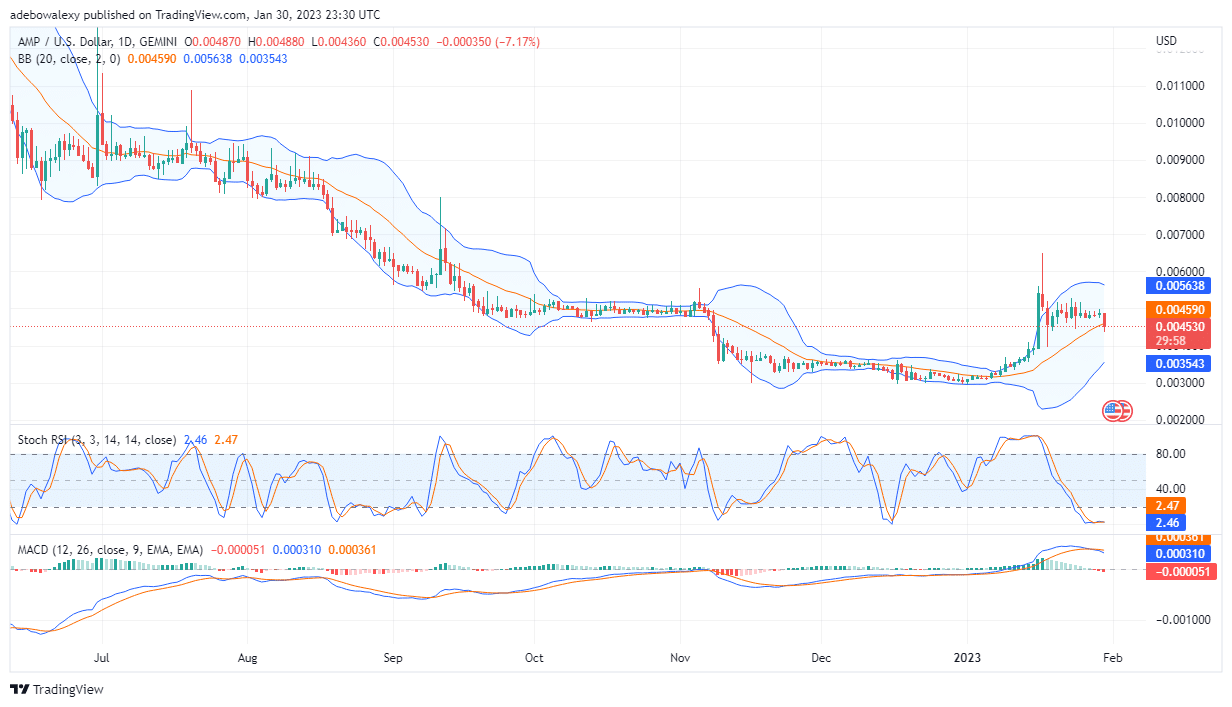
AMP/USD Price Is trying to Take an Upward Bounce
Price activities on the AMP/USD market on the daily market in this new session showed a sign of a recovery attempt at the lower limit of the Bollinger band indicator. The last price candle here is a bullish one. And, this last price candle was significant enough to initiate an upside crossover. However, on the contrary, the MACD indicator is showing that the downward retracement of price in this market may still be gaining momentum. This is seen through the histogram bars of the indicator as they keep growing red below the equilibrium level. Therefore, you may still want to maintain the opinion that the price may fall to around $0.004490.
- Broker
- Min Deposit
- Score
- Visit Broker

- Award-winning Cryptocurrency trading platform
- $100 minimum deposit,
- FCA & Cysec regulated

- 20% welcome bonus of upto $10,000
- Minimum deposit $100
- Verify your account before the bonus is credited
- Fund Moneta Markets account with a minimum of $250
- Opt in using the form to claim your 50% deposit bonus
Learn to Trade
Never Miss A Trade Again

Signal Notification
Real-time signal notifications whenever a signal is opened, closes or Updated

Get Alerts
Immediate alerts to your email and mobile phone.

Entry Price Levels
Entry price level for every signal Just choose one of our Top Brokers in the list above to get all this free.