STELLAR Price Analysis – June 01
Should the daily candle close above the $0.16 resistance level by the bulls’ pressure, then, Stellar price may incline to $0.20 levels and may extend to $0.23. In case the sellers push the price to penetrate the support level of $0.11 downside, price may decline towards the support levels of $0.11, $0.09, and $0.08.
XLM/USD Market
Key Levels:
Resistance levels: $0.16, $0.20, $0.23
Support levels: $0.11, $0.09, $0.08
XLM/USD Long-term Trend: Bullish
Stellar is on the bullish movement on the daily chart. Last two weeks, there was no significant movement in the Stellar market when the buyers lost momentum and the sellers’ pressure was low. The support level of $0.11 was retested, a bullish engulfing candle formed and the price increases towards the resistance level of $0.16. Further price increase envisaged.
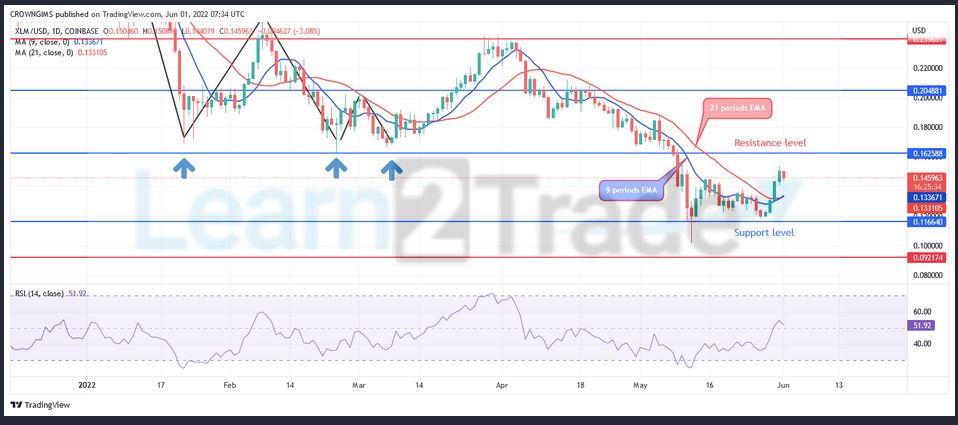
Stellar is trading above the 9 periods EMA and 21 periods EMA at a distance. The former is trying to cross above the later. Should the daily candle close above the $0.16 resistance level by the bulls’ pressure, then, Stellar price may incline to $0.20 levels and may extend to $0.23. In case the sellers push the price to penetrate the support level of $0.11 downside, price may decline towards the support levels of $0.11, $0.09, and $0.08.
XLM/USD Medium-term Trend: Bullish
Stellar is on bullish movement in the 4-hour chart. The price action has formed a double bottom chart pattern in the 4- hour chart. The crypto break out of the consolidation mode and commence a bullish movement. The price is targeting the resistance level of $0.16 at the moment.
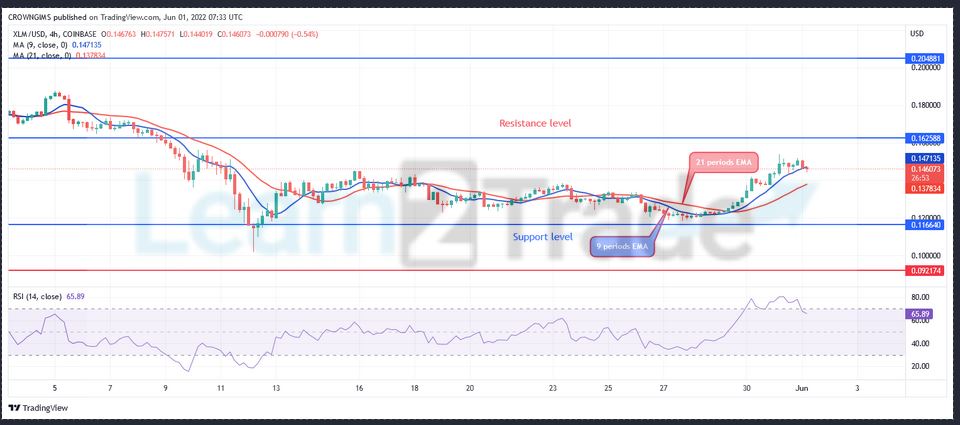
Stellar is trading above the 9 periods EMA and 21 periods EMA as a sign of bullish market. The Relative Strength Index periods 14 is at 63 levels and the signal line displaying bearish direction which may be a pullback.
You can purchase Lucky Block here: Buy LBlock
- Broker
- Min Deposit
- Score
- Visit Broker

- Award-winning Cryptocurrency trading platform
- $100 minimum deposit,
- FCA & Cysec regulated

- 20% welcome bonus of upto $10,000
- Minimum deposit $100
- Verify your account before the bonus is credited
- Fund Moneta Markets account with a minimum of $250
- Opt in using the form to claim your 50% deposit bonus
Learn to Trade
Never Miss A Trade Again

Signal Notification
Real-time signal notifications whenever a signal is opened, closes or Updated

Get Alerts
Immediate alerts to your email and mobile phone.

Entry Price Levels
Entry price level for every signal Just choose one of our Top Brokers in the list above to get all this free.