Orchid’s (OXT) price rose through the ceiling at the Fibonacci Retracement resistance level of 61.80 about three trading sessions ago. Although with reduced strength, price action has managed to keep retracing higher. Let’s find out what may soon happen in this market.
Orchid Analysis Data:
Orchid Value Now: $0.0895
OXTUSD Market Cap: $61.7 million
OXTUSD Moving Supply: 690 million
Orchid Total Supply: 1 billion
Orchid CoinMarketCap Ranking: 368
Major Price Levels:
Top: $0.0895, $0.0920, and $0.0960
Base: $0.0860, $0.0820, and $0.0620
 .0860" width="1232" height="707" data-lazy-src="https://learn2.trade/wp-content/uploads/2023/04/OXTUSD_2023-04-05_20-56-10.png"/>
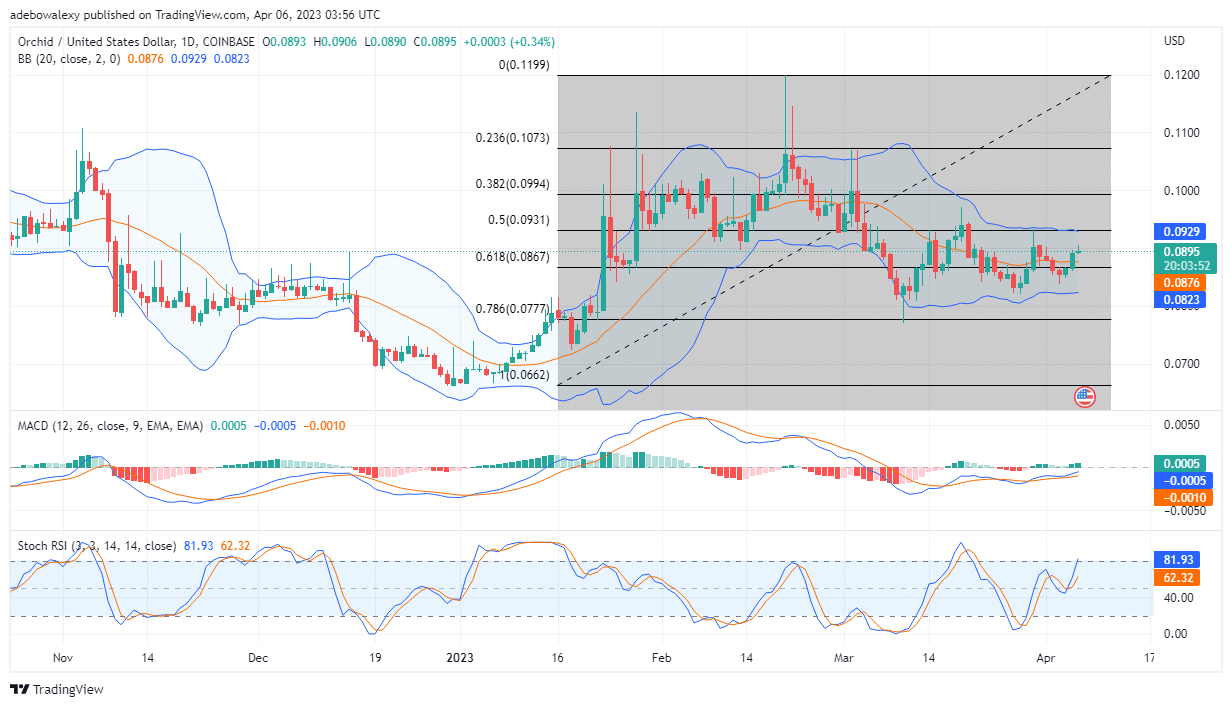
Orchid (OXT) May Find Support Above the 38.20 Fibonacci Level
On the OXT/USD daily chat, another price candlestick has appeared above the Fibonacci Retracement level of 61.80. This price candle has also appeared above the middle limit of the Bollinger Bands indicator. At the same time, the Moving Average Convergence Divergence line has kept rising steadily toward the equilibrium point. Also, studying the Stochastic Relative Strength indicator curves has stayed consistent with their upside move toward the oversold area of the indicator. On this front, it appears possible for Orchid’s price to rise higher.
.0860" width="1232" height="707" data-lazy-src="https://learn2.trade/wp-content/uploads/2023/04/OXTUSD_2023-04-05_20-57-04.png"/>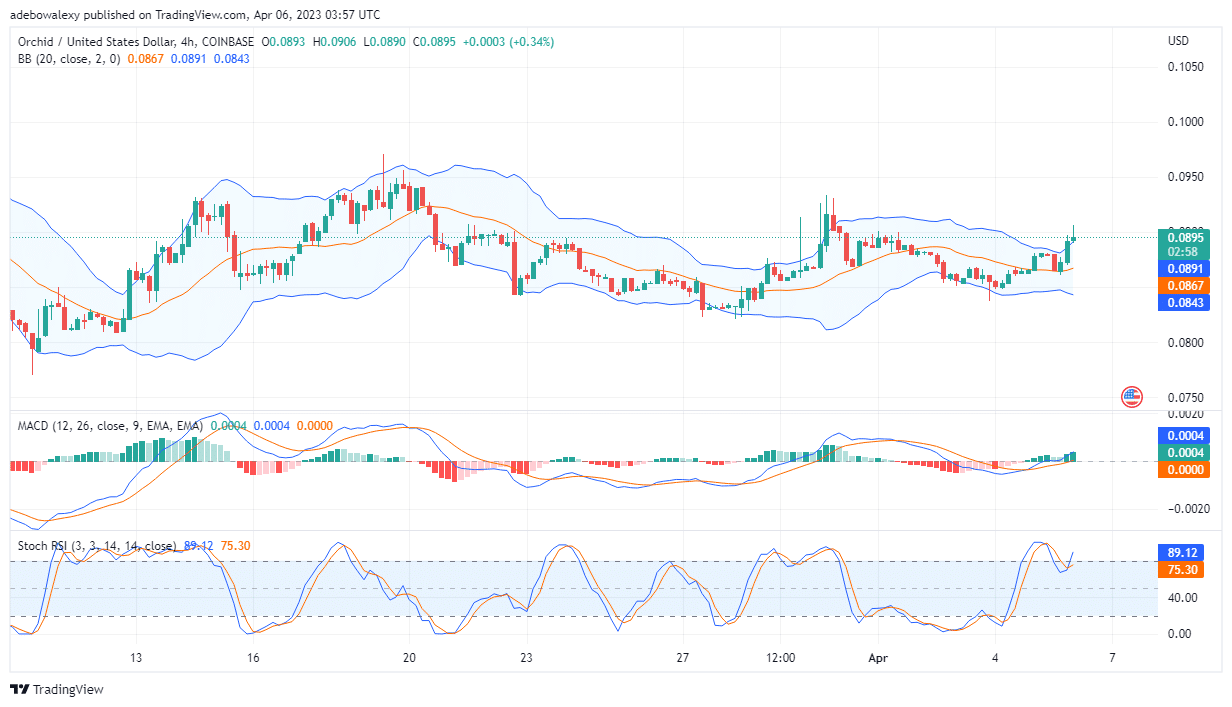
Orchid (OXT) Bulls May Be Stronger Than Anticipated
Even on the OXT/USD 4-hour market, signs of a possible upside continuation of price movements aren’t very far-fetched. Although price action has been above the middle limit of the Bollinger Bands indicator for some time, at this point the price candle seems to have taken a strong rebound to the upside. Additionally, the lines of the MACD indicator have now crossed the 0.00 level. Also, the bullish crossover seen in the daily market has been replicated in this time frame too. The histogram bars of the MCAD indicator are also green and increasing in length. Consequently, this suggests that this market is more likely to hit the $0.0910 mark.
- Broker
- Min Deposit
- Score
- Visit Broker

- Award-winning Cryptocurrency trading platform
- $100 minimum deposit,
- FCA & Cysec regulated

- 20% welcome bonus of upto $10,000
- Minimum deposit $100
- Verify your account before the bonus is credited
- Fund Moneta Markets account with a minimum of $250
- Opt in using the form to claim your 50% deposit bonus
Learn to Trade
Never Miss A Trade Again

Signal Notification
Real-time signal notifications whenever a signal is opened, closes or Updated

Get Alerts
Immediate alerts to your email and mobile phone.

Entry Price Levels
Entry price level for every signal Just choose one of our Top Brokers in the list above to get all this free.