FTSE 100 Analysis – June 11
FTSE 100 approaches a supply zone with a potential bearish reversal setup. The FTSE 100 Index has maintained a steady upward movement in recent weeks, but current technical indicators suggest a possible turning point. The 9-day Simple Moving Average (SMA), currently positioned near $8,780, has served as short-term support throughout the rally. However, the Relative Strength Index (RSI) is around 67, nearing the overbought level of 70, which could indicate that bullish momentum is losing strength. This alignment of price action and technical indicators near critical levels often precedes a corrective movement or a trend reversal.
FTSE 100 Key Levels
Resistance Levels: $8,800, $9,000, $9,200
Support Levels: $8,480, $8,110, $7,540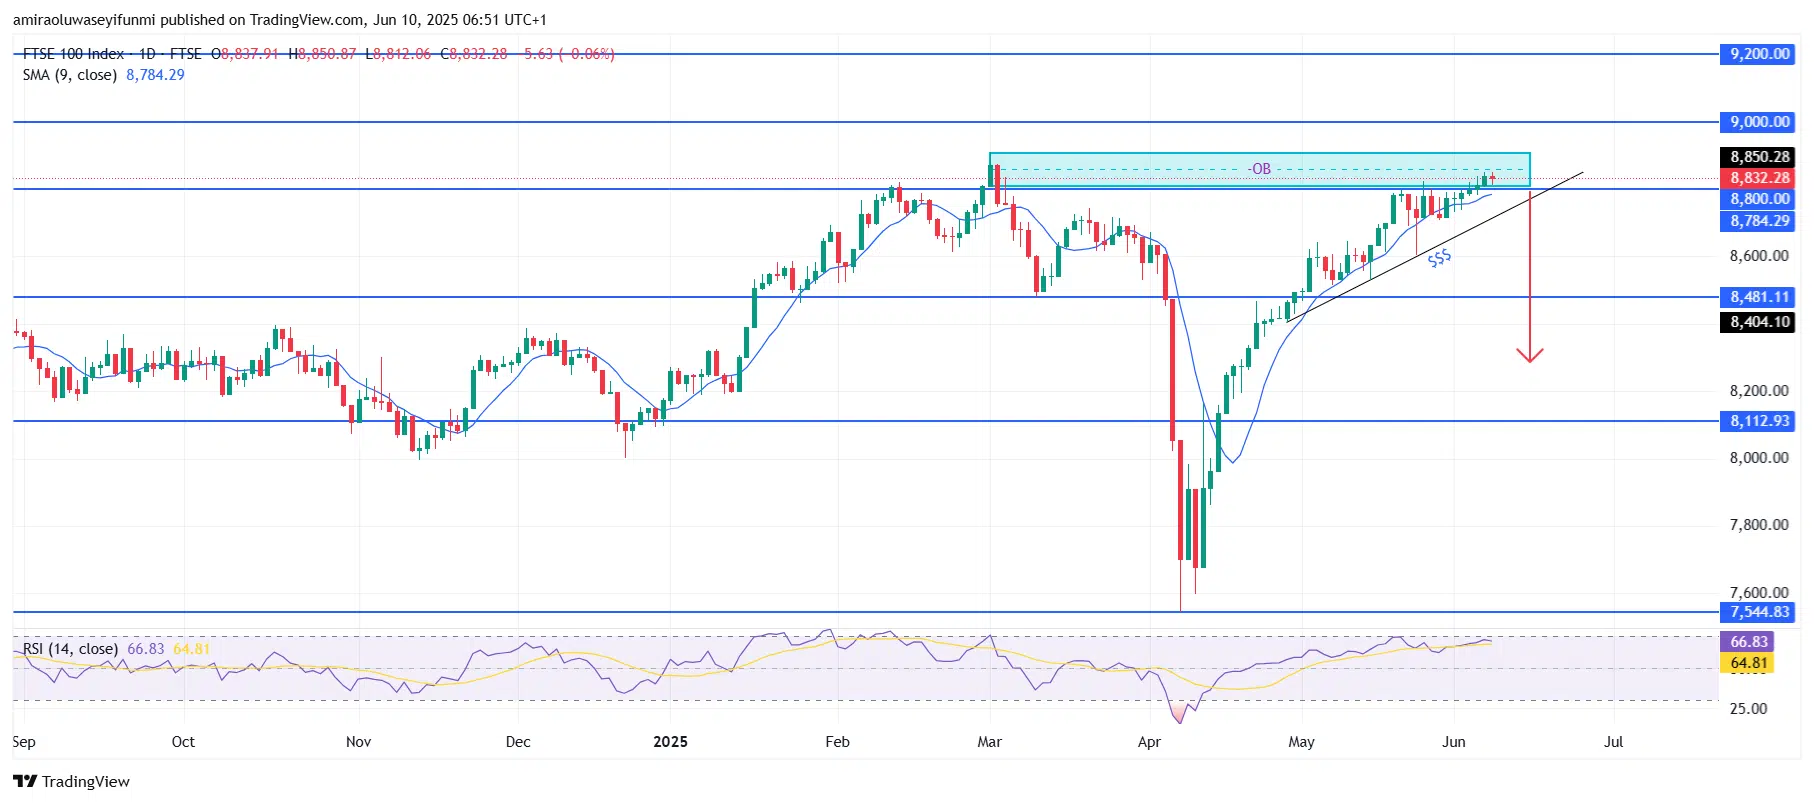
FTSE 100 Long-Term Trend: Bearish
From a technical standpoint, price action has recently tested the $8,800 resistance level within a clearly defined order block zone, suggesting potential institutional selling activity. Candlestick formations in this area indicate indecision, and the market has not managed to produce a strong bullish breakout beyond this level. The ascending trendline, established from higher lows since mid-April, is under pressure, and a close below this dynamic support could lead to broader distribution. Previous price rejections at this supply zone further affirm its role as a significant resistance area.
Looking ahead, a breakdown below the $8,780 SMA and trendline support could initiate a bearish movement toward the $8,480 horizontal support level. If this level fails to hold, the next target is near $8,110, with an extended bearish move potentially reaching $7,540. This bearish outlook will likely remain unless the price convincingly breaks and sustains above the $9,000 resistance level. For traders seeking timely market guidance, this could be a signal-rich environment for interpreting forex signals effectively. For now, technical pressure continues to favor downside risks.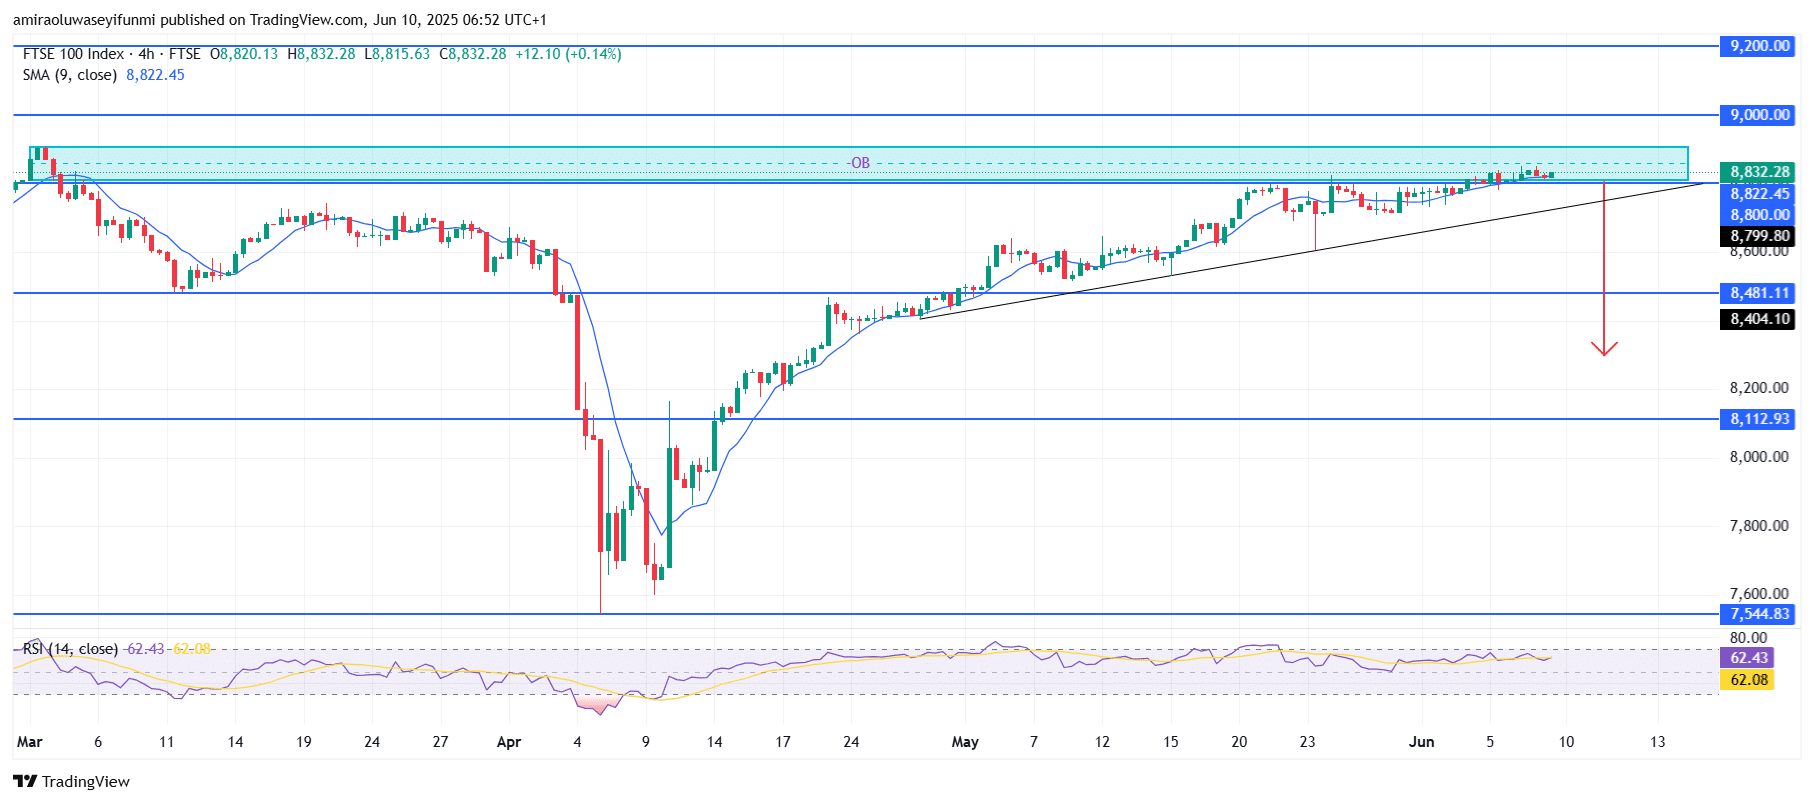
FTSE 100 Short-Term Trend: Bearish
FTSE 100 is currently trading within a bearish order block zone near $8,830, displaying signs of exhaustion as price struggles to push higher. The rising wedge pattern, coupled with a flattening RSI at 62.43, points to diminishing bullish momentum.
Price remains just above the ascending trendline and the 9-period SMA at $8,820, both of which appear susceptible to a downside break. A confirmed decline below $8,800 could prompt a rapid fall toward $8,480 or potentially $8,110.
Make money without lifting your fingers: Start using a world-class auto trading solution
How To Buy Lucky Block – Guide, Tips & Insights | Learn 2 Trade
Note: Learn2.trade is not a financial advisor. Do your research before investing your funds in any financial asset, product, or event. We are not responsible for your investment results.
- Broker
- Min Deposit
- Score
- Visit Broker

- Award-winning Cryptocurrency trading platform
- $100 minimum deposit,
- FCA & Cysec regulated

- 20% welcome bonus of upto $10,000
- Minimum deposit $100
- Verify your account before the bonus is credited
- Fund Moneta Markets account with a minimum of $250
- Opt in using the form to claim your 50% deposit bonus
Learn to Trade
Never Miss A Trade Again

Signal Notification
Real-time signal notifications whenever a signal is opened, closes or Updated

Get Alerts
Immediate alerts to your email and mobile phone.

Entry Price Levels
Entry price level for every signal Just choose one of our Top Brokers in the list above to get all this free.