FTSE 100 Analysis – June 4
The FTSE 100 is facing difficulty at resistance, indicating a potential bearish turnaround. Technical indicators suggest a possible shift in sentiment for the FTSE 100 Index. The Relative Strength Index (RSI) is hovering around 63, just below the overbought threshold, indicating a decline in upward momentum. The price is oscillating just beneath the 9-period Simple Moving Average (SMA), currently near $8,750, which signals that the bullish trend may be losing steam. With momentum fading and price unable to break higher convincingly, these signs suggest that a downward movement may be developing.
FTSE 100 Key Levels
Resistance Levels: $8800, $9000, $9200
Support Levels: $8480, $8110, $7540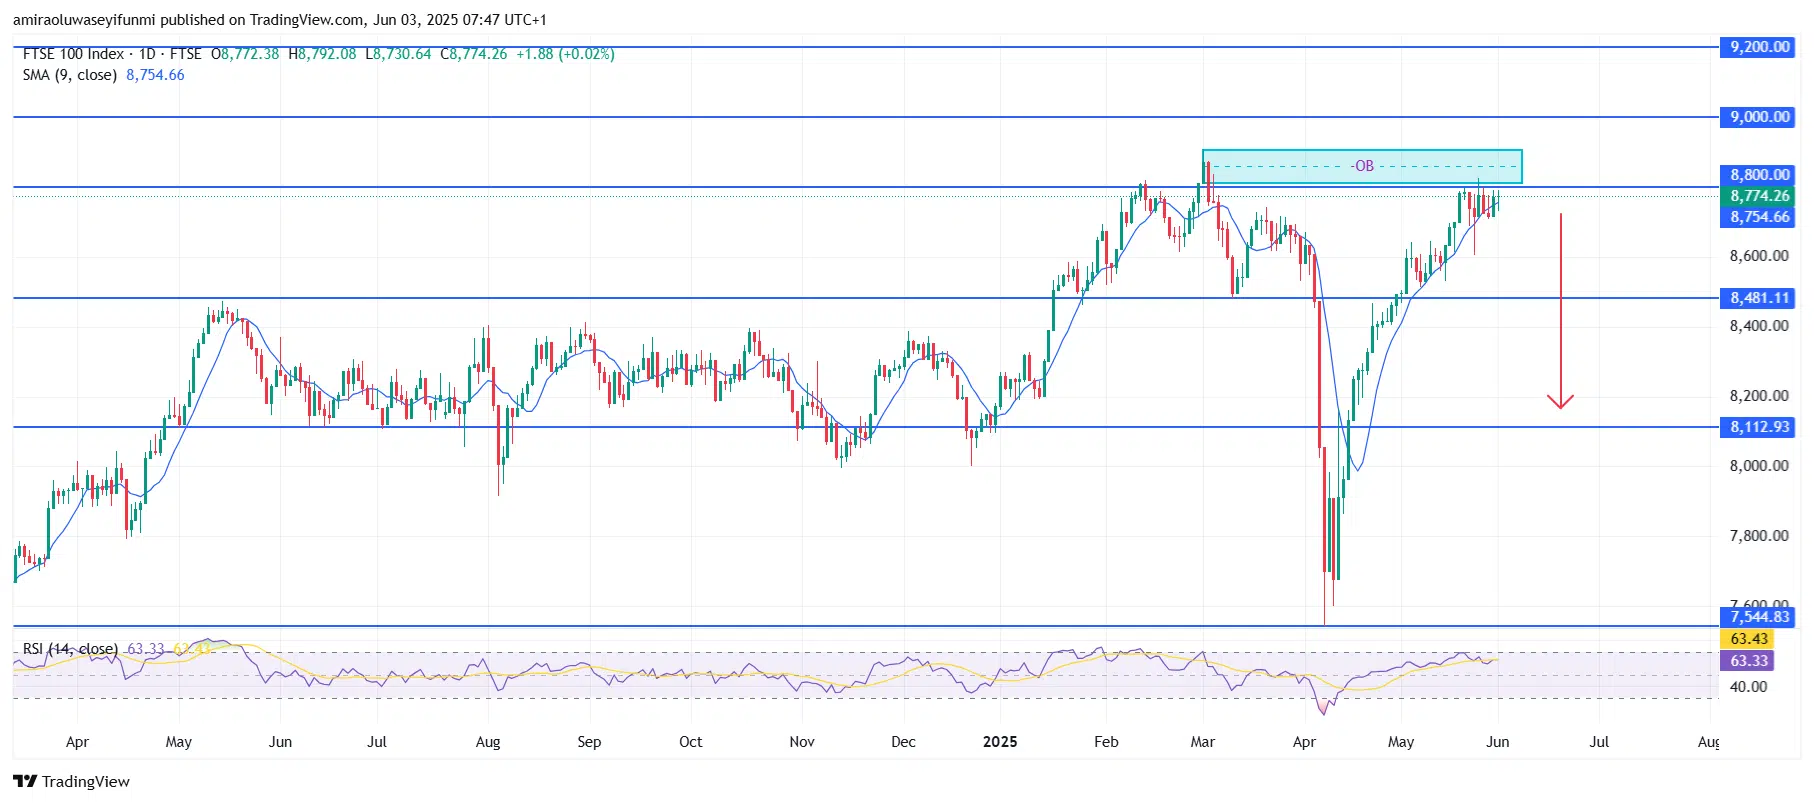
FTSE100 Long-Term Trend: Bearish
The price action indicates that the index has once again encountered resistance within the well-established supply zone between approximately $8,800 and $9,000, a region where past rallies have repeatedly failed. Recent candlestick patterns, characterized by long upper wicks and narrow bodies, reflect market indecision and waning buyer interest. This latest rejection at the overhead resistance strengthens the bearish outlook and suggests that the market may be preparing for a pullback. Every attempt to surpass this zone has met with strong selling pressure, demonstrating the prevailing influence of supply.
Looking forward, if the index remains unable to gain traction above $8,800, sellers could drive the price down toward the nearby support at $8,480. A drop below that level might clear the way for further decline toward $8,110, with extended weakness potentially dragging the index down to $7,540. In light of the current rejection pattern and diminishing momentum, the short-term technical perspective leans clearly bearish unless a decisive breakout above $9,000 occurs. Traders monitoring forex signals may also view these developments as confirming a broader risk-off sentiment.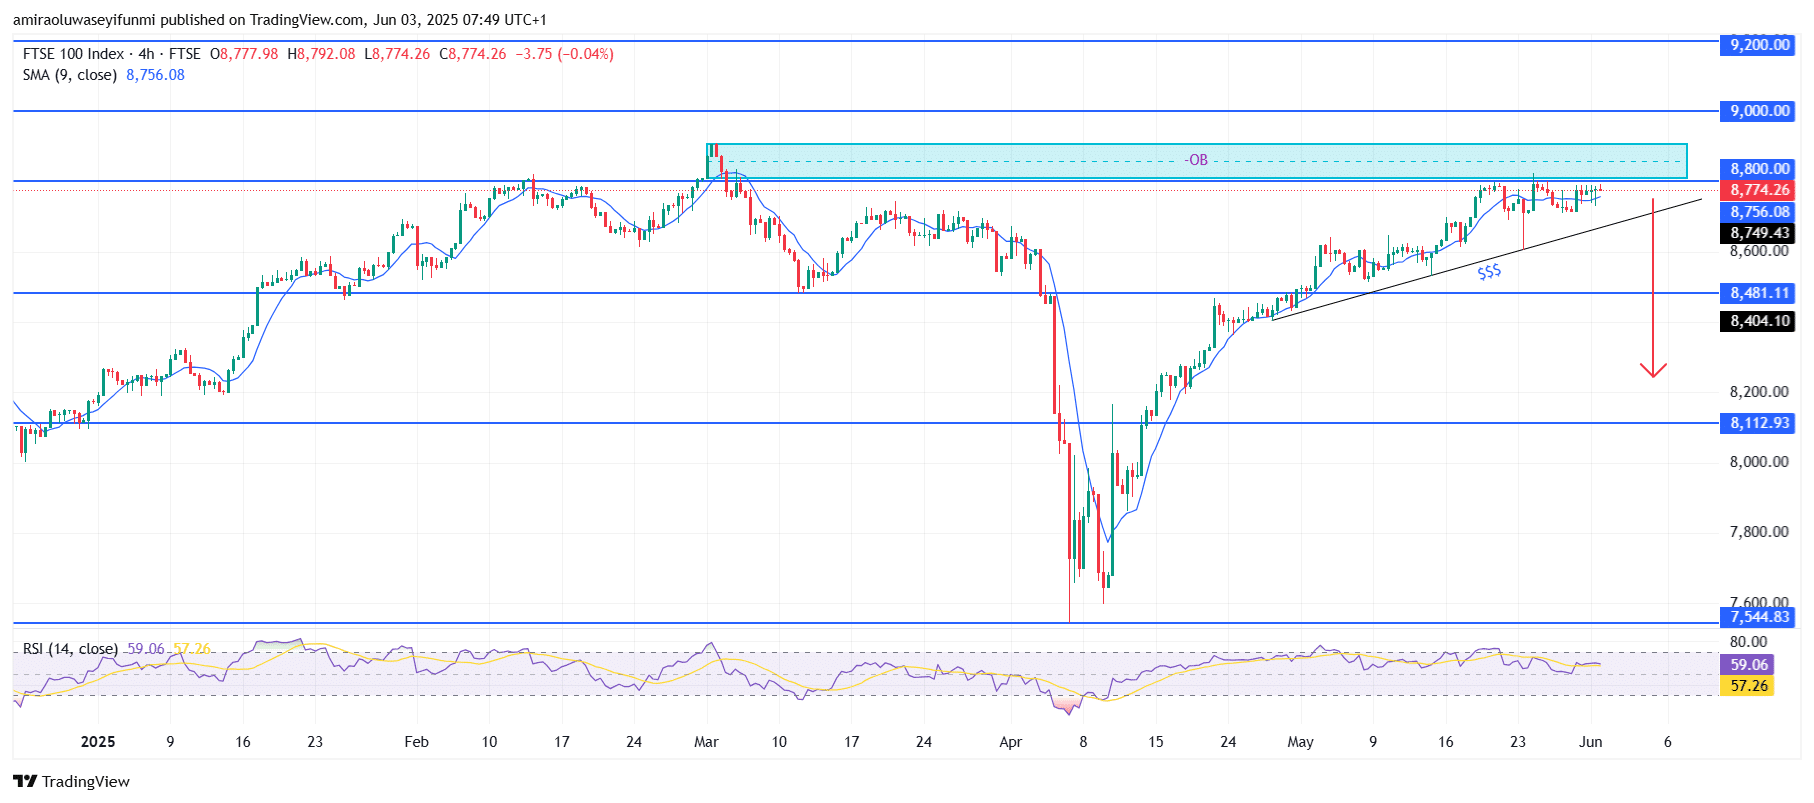
FTSE100 Short-Term Trend: Bearish
The FTSE 100 is beginning to display bearish tendencies as it continues to struggle with the $8,800.00 resistance within the supply zone. A lower high has formed while price closely follows an ascending trendline, pointing to decreasing bullish momentum.
On the 4-hour chart, the RSI has fallen to 59.06 and continues to decline, indicating weakening buying strength. A break beneath the trendline support could trigger a sharper move toward the $8,480 demand zone.
Make money without lifting your fingers: Start using a world-class auto trading solution
How To Buy Lucky Block – Guide, Tips & Insights | Learn 2 Trade
Note: Learn2.trade is not a financial advisor. Do your research before investing your funds in any financial asset, product, or event. We are not responsible for your investment results.
- Broker
- Min Deposit
- Score
- Visit Broker

- Award-winning Cryptocurrency trading platform
- $100 minimum deposit,
- FCA & Cysec regulated

- 20% welcome bonus of upto $10,000
- Minimum deposit $100
- Verify your account before the bonus is credited
- Fund Moneta Markets account with a minimum of $250
- Opt in using the form to claim your 50% deposit bonus
Learn to Trade
Never Miss A Trade Again

Signal Notification
Real-time signal notifications whenever a signal is opened, closes or Updated

Get Alerts
Immediate alerts to your email and mobile phone.

Entry Price Levels
Entry price level for every signal Just choose one of our Top Brokers in the list above to get all this free.