USDJPY – Guide, Tips & Insights | Learn 2 Trade – Guide, Tips & Insights | Learn 2 Trade has maintained a consistent downward trend. Upon reaching 142.400, the price has struggled to break below the support level, resulting in multiple tests of the demand zone without a decisive reversal or breakout.
In January, the RSI (Relative Strength Index) signalled market weakness with a bearish divergence—price action formed a higher high while the RSI produced equal highs. This preceded a breakdown below the last major swing low at 148.650.
Following the sweep of the previous major low (148.650) within the prior bullish trend, the price retraced above this key level but faced rejection at the 50-period Moving Average. This triggered a sharp decline toward the 142.400 support level.
The price declined to 140.260 before retracing back to 142.400, with the RSI indicating oversold conditions. Since then, the pair has struggled to break decisively below this zone. The RSI hovers near 50 (equilibrium), leading to consolidation above support. Multiple swing lows have formed at 142.400, creating rich liquidity at the major zone. The best forex signals Telegram channels await one-sided price action to improve accuracy in such market conditions.
Trade on MT4 with Leverage up to 1:500! Trade on MT4 with Leverage up to 1:500!
X
We use cookies to ensure that we give you the best experience on our website. If you continue to use this site we will assume that you are happy with it.

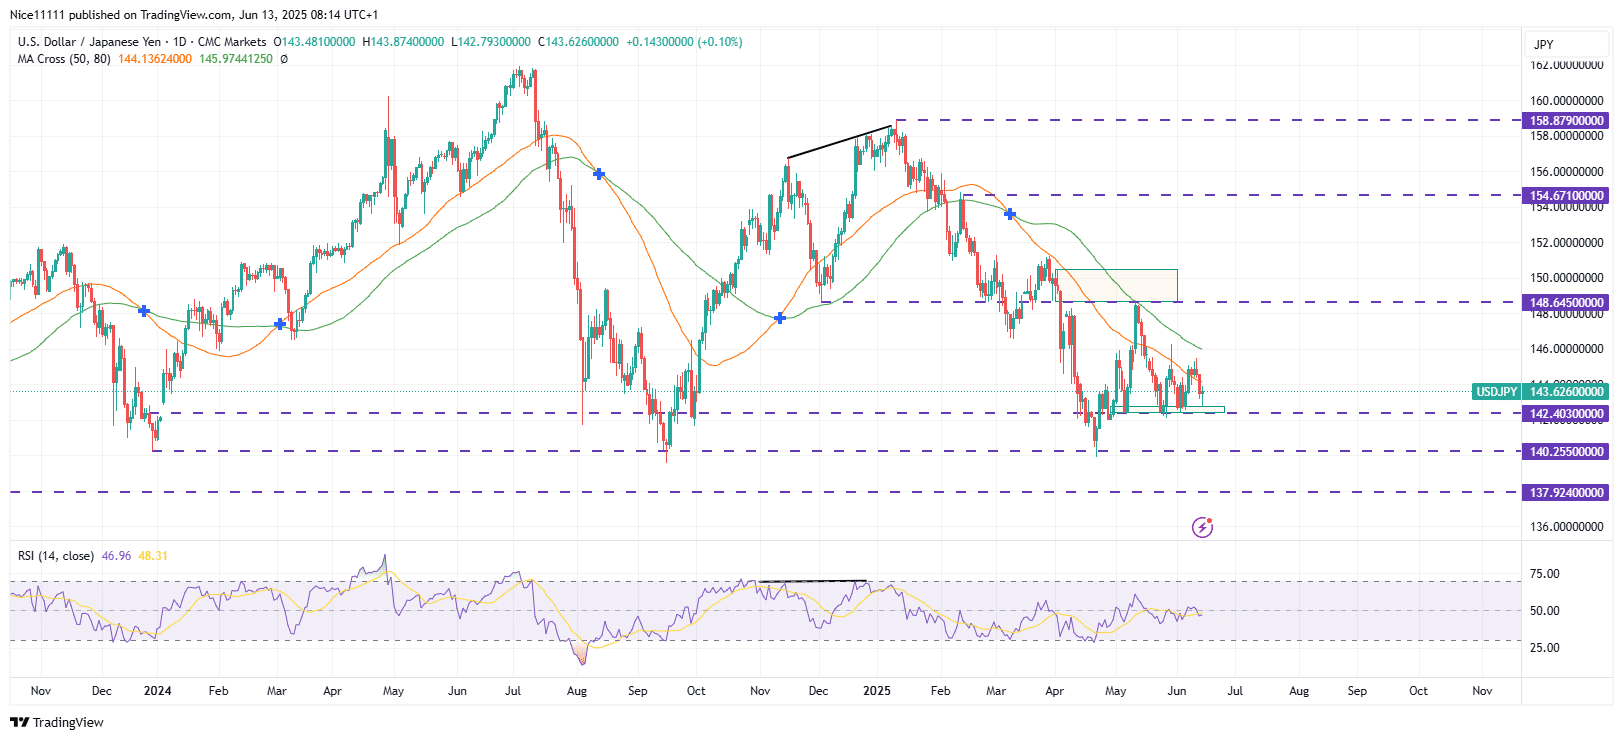
 USDJPY – Guide, Tips & Insights | Learn 2 Trade – Guide, Tips & Insights | Learn 2 Trade Short-Term Trend: Ranging


