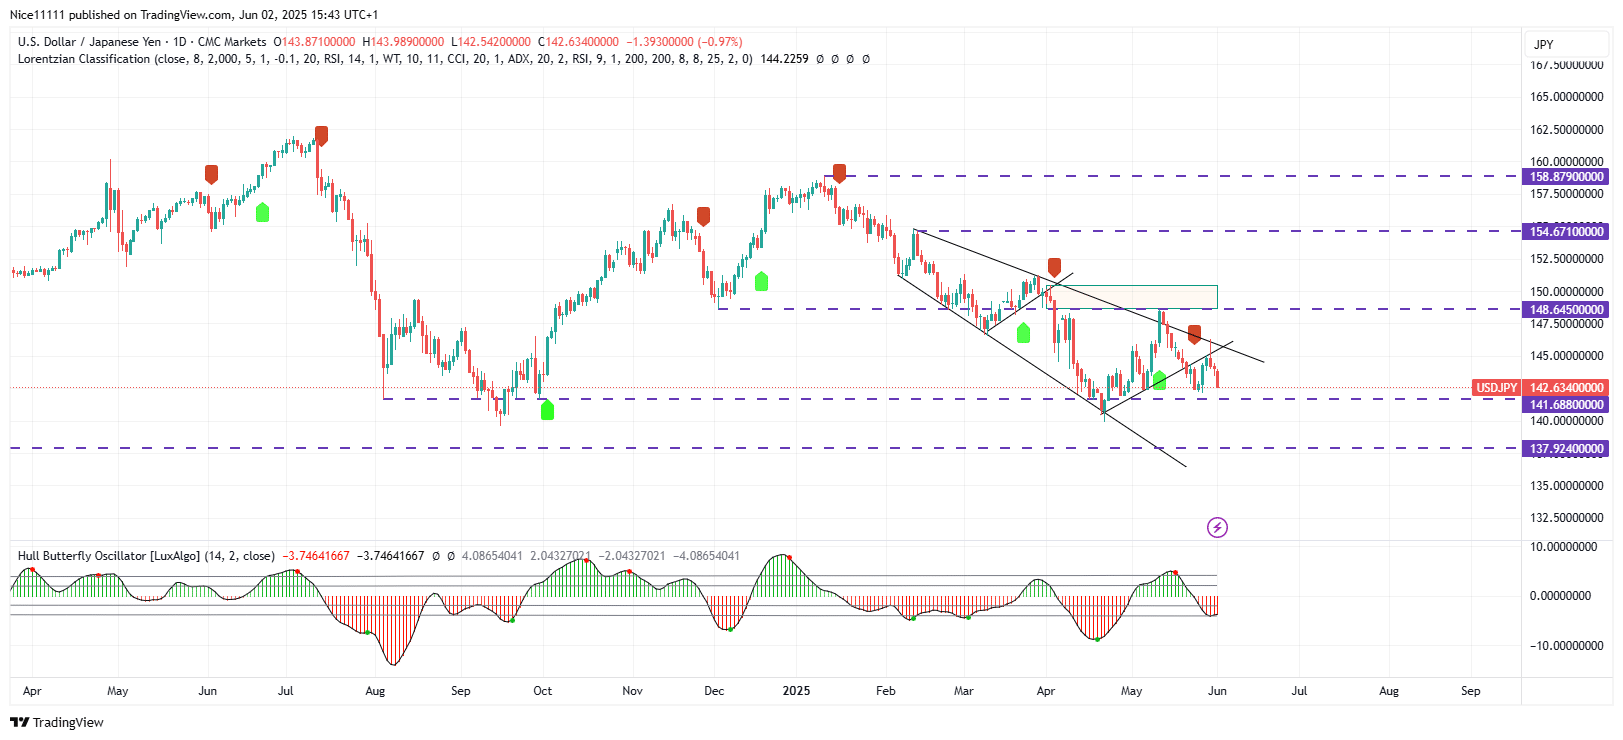
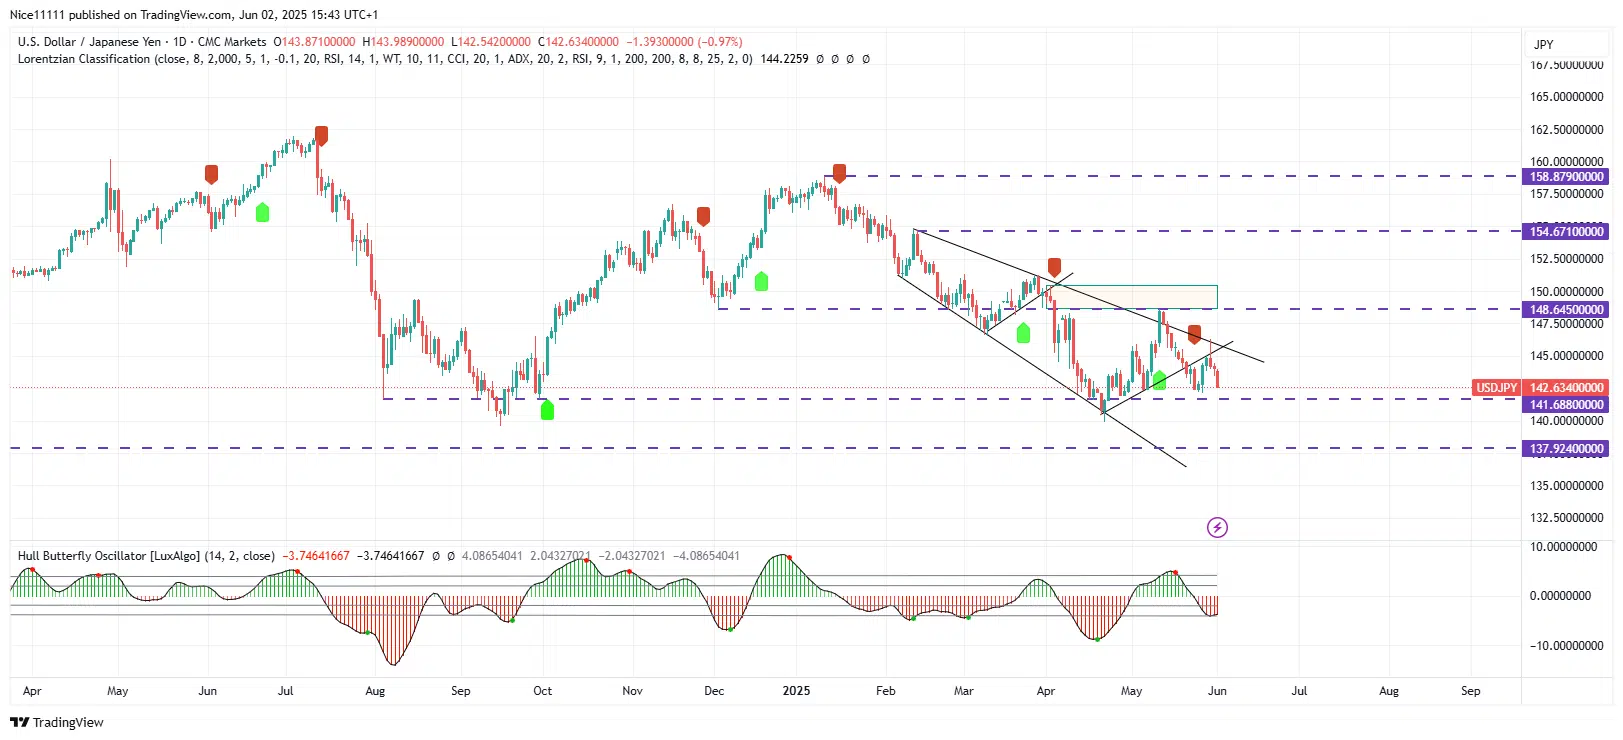
USDJPY – Guide, Tips & Insights | Learn 2 Trade – Guide, Tips & Insights | Learn 2 Trade has been declining steadily within an expanding channel on the daily chart. A rejection candle signalled the end of the bullish retracement within the channel before the price resumed its downward movement.
The current bearish trend began in January at 158.890 and has seen multiple significant pullbacks. In March, the price climbed along a bullish trendline (visible on the 4-hour chart) but reversed sharply upon reaching the expanding channel’s resistance trendline.
After retesting the demand level at 141.670, the price staged another retracement along a bullish trendline. A false breakout above the expanding channel led to a rally toward an unmitigated bearish order block within a fair value gap at 148.650 before reversing. The Hull Butterfly indicator flagged an overbought market at the reversal point. Just before revisiting 141.670, another pullback tested the resistance trendline, where a rejection candle formed, confirming continuation of the bearish trend.
The price is now approaching the support level at 141.670. The Hull Butterfly oscillator confirms bearish momentum on both the daily and 4-hour charts, while the Machine Learning Lorentzian Classification Indicator aligns with the downtrend. The price appears poised to challenge the liquidity-rich zone marked by relatively equal lows near the 141.670 demand level.
Trade on MT4 with Leverage up to 1:500! Trade on MT4 with Leverage up to 1:500!
X
We use cookies to ensure that we give you the best experience on our website. If you continue to use this site we will assume that you are happy with it.
 USDJPY – Guide, Tips & Insights | Learn 2 Trade – Guide, Tips & Insights | Learn 2 Trade Short-Term Trend – Bearish
 USDJPY – Guide, Tips & Insights | Learn 2 Trade – Guide, Tips & Insights | Learn 2 Trade Short-Term Trend – Bearish


