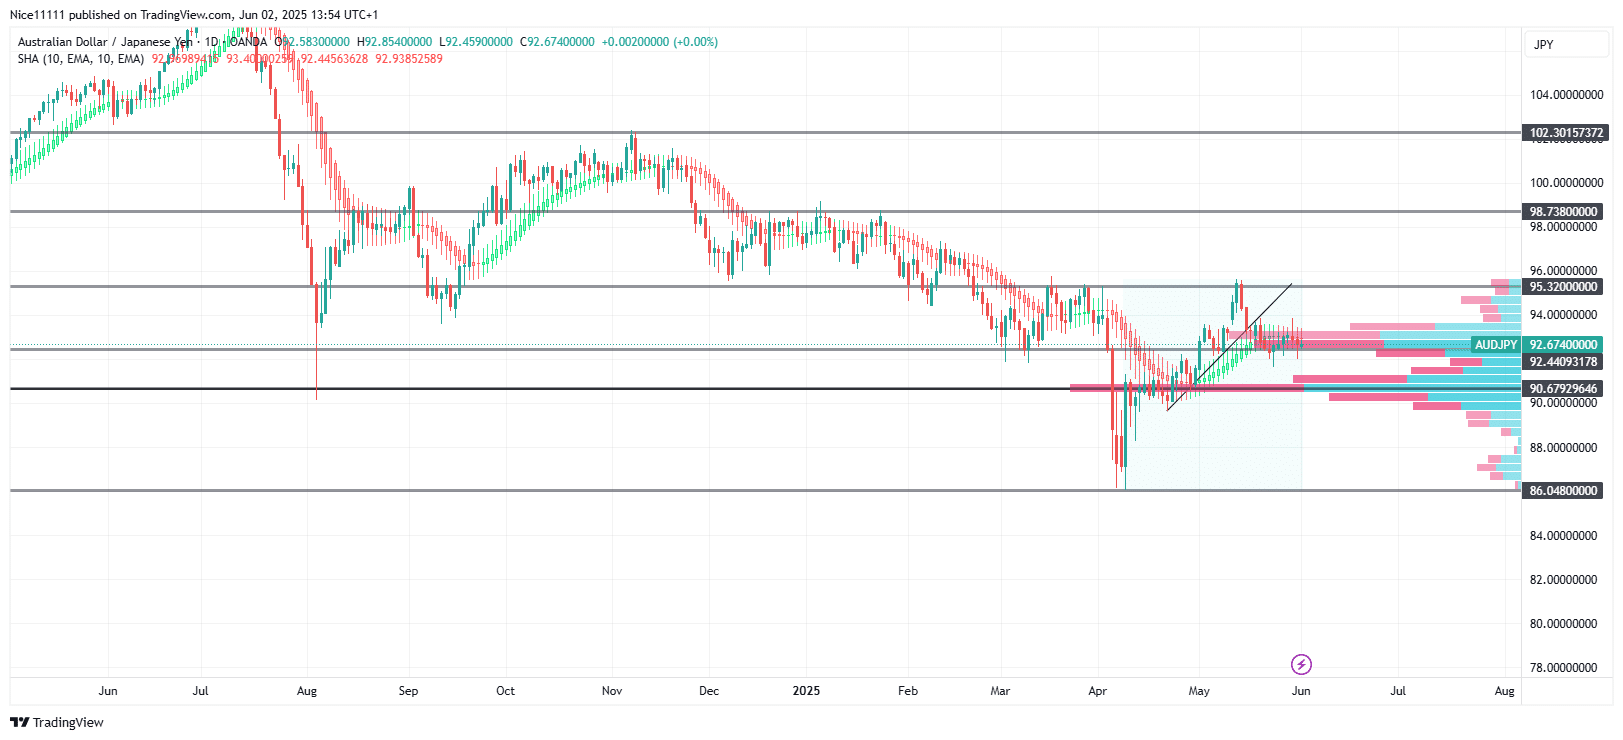
AUDJPY initiated a significant bullish retracement in April after testing the major support level of 86.050. The bearish trend was further threatened by the consistent bullish market structure, which eventually surpassed the last major swing high on the bearish trend. The price has fallen from the resistance zone at 95.320, breaking through a supporting trendline to continue the bearish motion.
AUDJPY has formed a head and shoulders pattern on the daily chart. During the bullish retracement, the price retraced to 92.440 as support before reaching 95.320. A swing high formed at 95.320, indicating termination of the bullish retracement.
A bullish trendline visible on the 4-hour chart was also broken after the formation of the swing high at 95.320, further confirming the bearish continuation. The Smoothened Heikin Ashi Candles have turned red once again, reinforcing the downward motion.
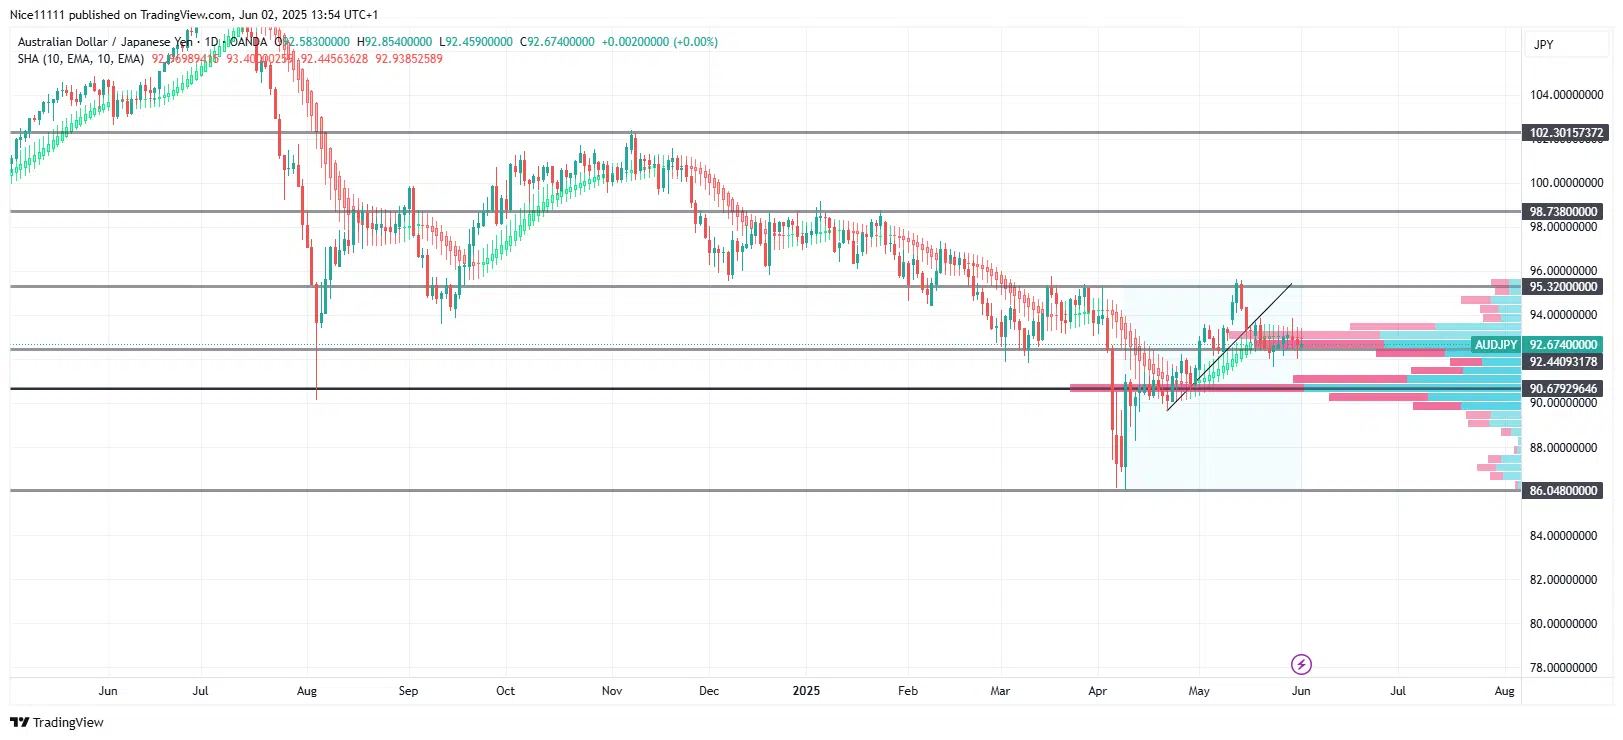
The price decline from 95.320 has halted at 92.440. This key price level has consistently provided support this year. Upon testing, the price has rebounded to the upside four times this year. The Anchored Volume Profile shows significant volume at that price. Sellers have resumed attacking the key level to sustain the bearish motion.
AUDJPY Short-term Trend: Ranging
On the lower timeframe, the price hovers around the support level of 90.680, repeatedly attempting to enforce a breakout. This has led to sideways motion on the 4-hour chart. A bearish breakout should open the door for a price spill to the next major zone at 90.680. The Anchored Volume Profile shows higher levels of market participation at that price, making it a good target for the best forex signal channels on Telegram.
Trade on MT4 with Leverage up to 1:500! Trade on MT4 with Leverage up to 1:500!
X
We use cookies to ensure that we give you the best experience on our website. If you continue to use this site we will assume that you are happy with it.
 AUDJPY Short-term Trend: Ranging
 AUDJPY Short-term Trend: Ranging


