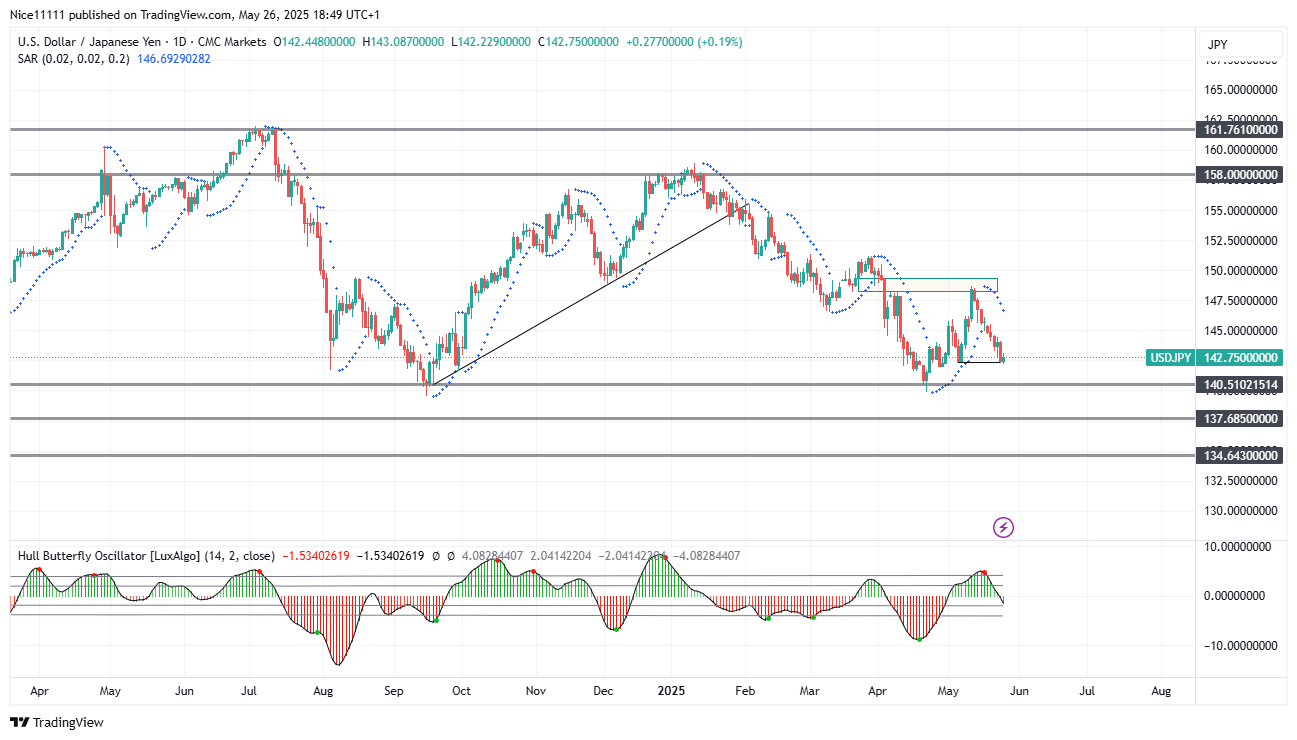
USDJPY – Guide, Tips & Insights | Learn 2 Trade – Guide, Tips & Insights | Learn 2 Trade bulls have lost steam as a fresh bearish break of the structure confirms the dominance of sellers in the market. After a brief retracement, the price is now resuming its bearish motion toward the significant demand level at 140.510, where a strong bullish pullback previously originated.
The Hull Butterfly Oscillator previously indicated an oversold condition around the 140.510 level, prompting a bullish correction within the broader bearish environment. This retracement was characterised by the formation of short-term bullish market structures, which propelled price action upward toward 149.000.
.
The 149.000 level aligns with a prominent fair value gap that is more distinctly visible on the weekly timeframe. As the price approached this gap, selling pressure resumed. A sequence of bearish daily candles followed, signaling the end of the retracement phase. The appearance of parabolic SAR (Stop and Reverse) dots above the candles confirmed the return of downward pressure, reinforcing the bearish sentiment in the market.
The Price has broken below the last swing low that defined the bullish pullback. This indicates a structural shift back in favour of the bears. This bearish continuation is consistent with the broader trend. With momentum increasing to the downside, the best forex signals channels and short-term traders may begin targeting the demand zone at 140.510 as the next major area of interest. A sustained break below this level could open the door for further declines toward 137.690 and possibly 134.640.
Trade on MT4 with Leverage up to 1:500! Trade on MT4 with Leverage up to 1:500!
X
We use cookies to ensure that we give you the best experience on our website. If you continue to use this site we will assume that you are happy with it.

 USDJPY – Guide, Tips & Insights | Learn 2 Trade – Guide, Tips & Insights | Learn 2 Trade Short-term Trend: Bearish


