EUR/JPY Significant Levels
Resistance Levels: 182.50, 185.00, 187.50
Support Levels: 180.00, 177.50, 175.50
EUR/JPY Long-Term Trend: Bullish
The EUR/JPY market seems to have started a trend reversal move. This opinion stems from the fact that price action has been on a medium-term downward retracement. This actually started when the Japanese yen began gaining strength against its counterpart. Meanwhile, the euro maintained a rather calm stance on the fundamental front. Technically, this seems to have tipped the balance of the long-term upward trend, causing a multi-session downward retracement in this market.
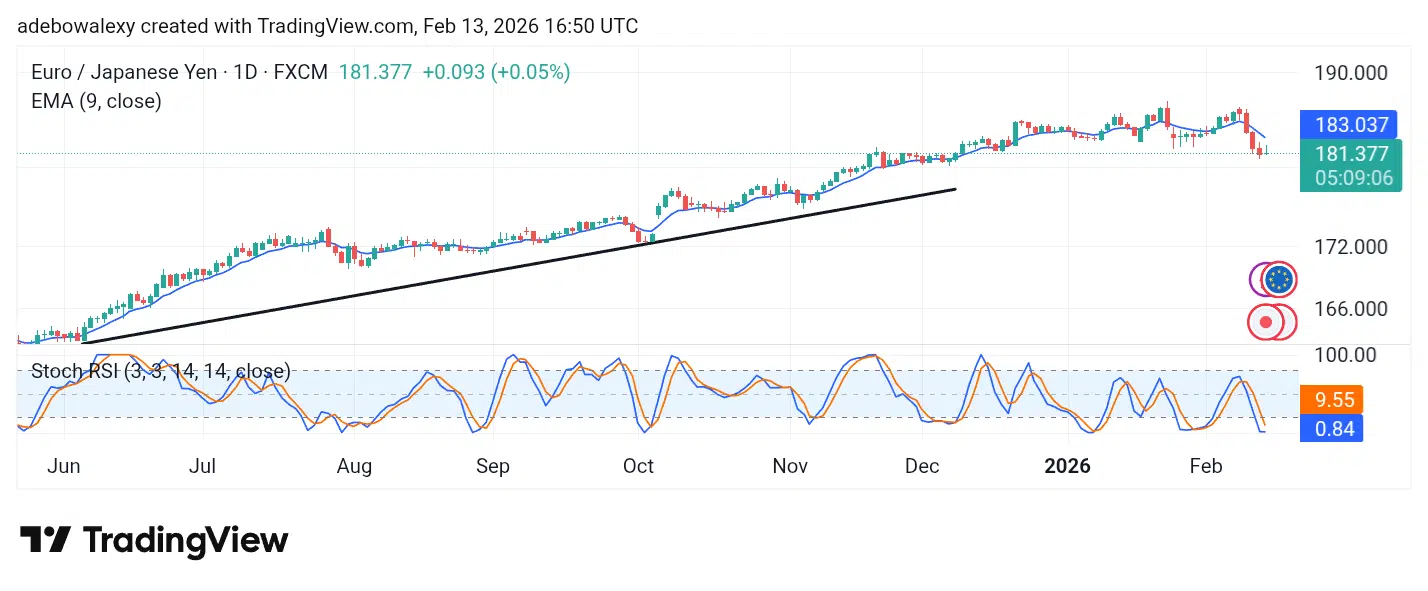
Daily Chart Indicator Readings
On the 24-hour EUR/JPY market, one can see that price activity has been on a southward trajectory consistently for four straight sessions. This has brought the market below the 9-day Exponential Moving Average (EMA) line. The ongoing session is represented by a thin green price candle, which also stays below the 9-day EMA curve. Furthermore, the lines of the Stochastic Relative Strength Index (SRSI) indicator are in the oversold zone, with the lead line already at the 0.84 mark.
EUR/JPY Medium-Term Trend: Bearish
On the medium term, the 4-hour chart shows that price action remains largely subdued. Over the past sessions, price activity can be seen oscillating widely. Recently, the market has been moving within a narrow range without tighter price action. This aligns with price staying below the 9-day EMA curve. Similarly, the SRSI indicator shows that the market has seen a trend shift, judging by its crossover.
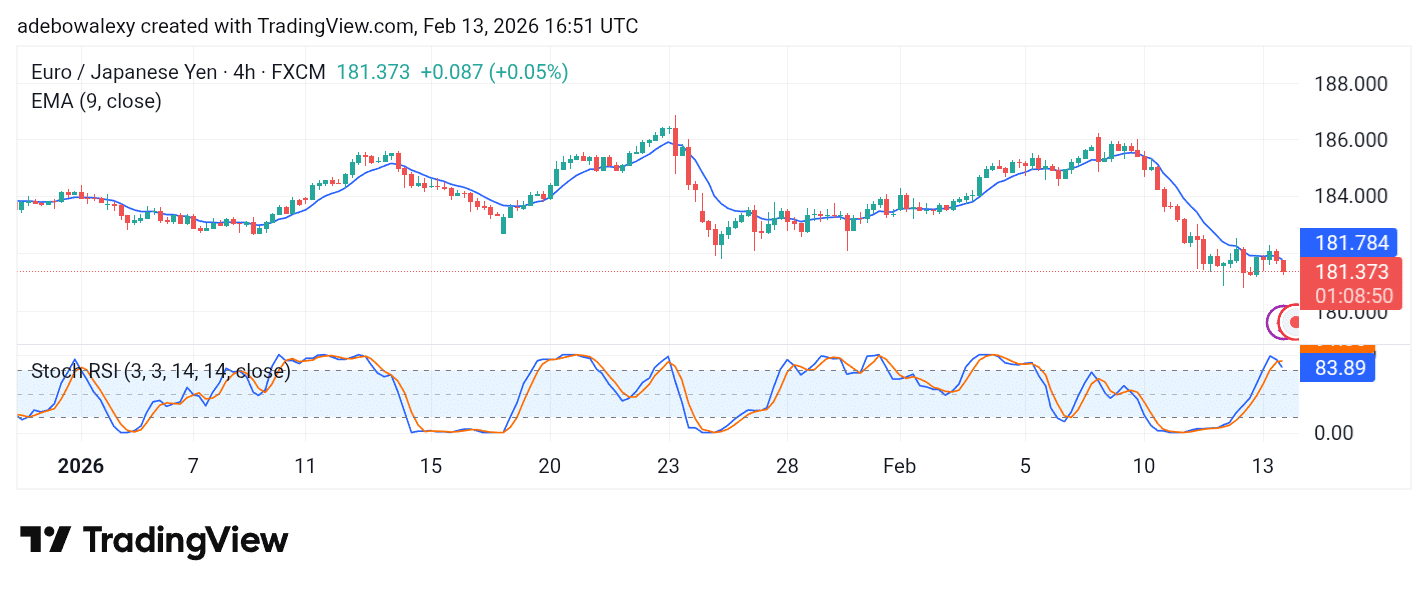
4-Hour Chart Indicator Readings
On the EUR/JPY 4-hour chart, we can see that price action still retains a bearish stance. Recent price candles remain below the 9-day EMA curve. Also, for two straight sessions, price activity has been edging lower. The SRSI indicator lines have delivered a downward crossover in the overbought region, clearly indicating an overbought condition.
General Outlook for EUR/JPY
From the daily chart, it can be observed that price activity has retreated from its long-term upward trajectory. As such, price action fell below the critical 9-day EMA level. The ongoing session seems to be presenting some resistance to the recent trend but appears largely weak. The SRSI indicator lines are deep in the oversold region and seem poised to remain there.
On the 4-hour chart as well, price activity continues moving southward. The last two price candles are red and continue to edge below the 9-day EMA curve. The SRSI lines have delivered a downward crossover in the overbought region. As such, the general outlook of the market remains bearish, with movement toward the support at the 180 level.
Make money without lifting your fingers: Start trading smarter today
Related Resources
- Forex Signals — professional daily trading signals
- Crypto Signals — real-time BTC, ETH, SOL and XRP alerts
- Join VIP — get early signals before the free channel
- Broker
- Min Deposit
- Score
- Visit Broker

- Award-winning Cryptocurrency trading platform
- $100 minimum deposit,
- FCA & Cysec regulated

- 20% welcome bonus of upto $10,000
- Minimum deposit $100
- Verify your account before the bonus is credited
- Fund Moneta Markets account with a minimum of $250
- Opt in using the form to claim your 50% deposit bonus
Learn to Trade
Never Miss A Trade Again

Signal Notification
Real-time signal notifications whenever a signal is opened, closes or Updated

Get Alerts
Immediate alerts to your email and mobile phone.

Entry Price Levels
Entry price level for every signal Just choose one of our Top Brokers in the list above to get all this free.