EUR/JPY Significant Levels
Resistance Levels: 185.00, 186.00, 187.00
Support Levels: 184.00, 183.00, 182.00
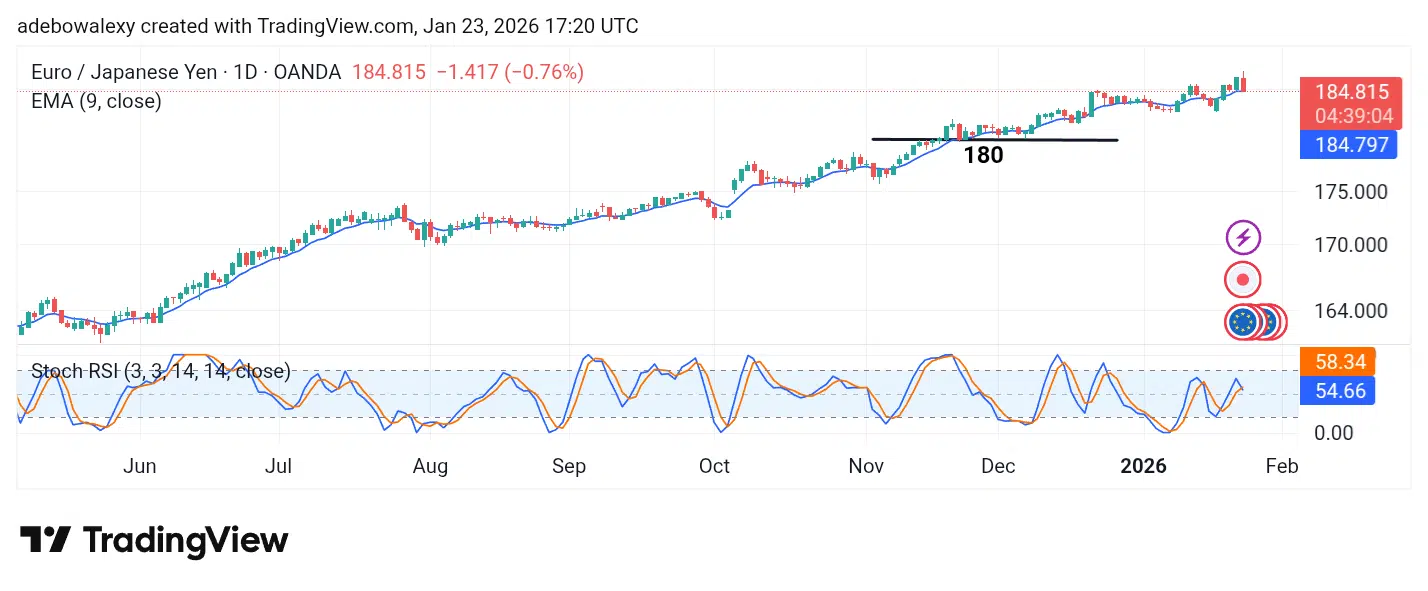
EUR/JPY Long-Term Trend: Bullish
Price action in the EUR/JPY market has been in a long-term upward trend. In fact, although today’s session turned bearish, price action remains above key technical levels. Notably, the market is closing the week at a higher level than where it opened at the start of the week.
The Japanese yen seems to be the weaker side of the pair, as there is speculation that the Japanese economy may experience consistent growth going forward. On the euro side, the market is attempting to offset this optimism with slightly improved Ifo Business Climate data, but this effort falls short.
Daily Chart Indicator Readings
As previously noted, price action in the EUR/JPY market remains above the 9-day EMA curve. However, the most recent price candle shows a notable downward retracement, printing a red candle above the EMA line. Despite this pullback, the Stochastic Relative Strength Index (SRSI) lines remain in convergence and still stand above the 50 threshold of the indicator.
EUR/JPY Medium-Term Trend: Bearish
On the EUR/JPY 4-hour chart, price action can be seen edging lower. The most recent price candle is a large bearish one. The selling pressure in the current session has pushed the pair below an important short-term technical level, suggesting that bearish forces may be capable of driving further declines in the near term.

4-Hour Chart Indicator Readings
Price action on the EUR/JPY 4-hour chart has moved below the 9-day EMA curve. Consequently, this signals that price action may be targeting lower levels. In the current session, the Stochastic RSI lines are falling rapidly toward the oversold region and have dropped below the 50 level of the indicator. The leading SRSI line stands at 6.22, while the lagging line is at 37.48.
General Outlook for EUR/JPY
The overall market outlook points to at least a short-term bearish bias. The daily chart shows that bears regained control during today’s trading session, as reflected by the latest price candle. However, the pair still trades above the 9-day EMA, preserving its long-term bullish structure.
On the 4-hour chart, price action has slipped below key technical levels, including the 9-day EMA. At the same time, the SRSI lines are plunging sharply into the oversold region. As a result, the pair may decline further toward the psychologically significant 184.00 price level.
Make money without lifting your fingers: Start trading smarter today
- Broker
- Min Deposit
- Score
- Visit Broker

- Award-winning Cryptocurrency trading platform
- $100 minimum deposit,
- FCA & Cysec regulated

- 20% welcome bonus of upto $10,000
- Minimum deposit $100
- Verify your account before the bonus is credited
- Fund Moneta Markets account with a minimum of $250
- Opt in using the form to claim your 50% deposit bonus
Learn to Trade
Never Miss A Trade Again

Signal Notification
Real-time signal notifications whenever a signal is opened, closes or Updated

Get Alerts
Immediate alerts to your email and mobile phone.

Entry Price Levels
Entry price level for every signal Just choose one of our Top Brokers in the list above to get all this free.