Login
Free Crypto Signals Join Our Telegram
All Forex Crypto EUR/USD Bitcoin Gold Trade Ideas Trading Briefs
https://www.tradingview.com/x/jow8x2Cp/ . Bitcoin Holds Ground as Bulls Aim for 0,000 Breakout BTCUSD bulls continue to fight for expansion Bitcoin continues to trade below the 0,000 key resistance level as bullish forces maintain dominance despite increasing pressure. The crypto market remains resilient, but buyers are struggling to push beyond the psychological barrier. BTCUSD Key Levels Resistance: 0,000, 97,000 Support: ,180, 000 Bitcoin has shown consistent bullish momentum throughout Q4 of 2024, marking one of the strongest quarters in recent years. After achieving a new all-time high earlier this quarter, the bullish market has faced headwinds, with price consolidating below the 0,000 level. The prolonged consolidation suggests that buyers are encountering resistance but remain committed to maintaining dominance. The market currently trades within a tight range, hinting at an impending breakout or breakdown depending on buyer and seller strength. The Stochastic Oscillator shows a gradual decline in bullish strength, reflecting the consolidation phase. The Momentum Indicator has flattened, indicating reduced market activity and signaling a need for renewed momentum to drive a breakout. Market Expectation On the 4-hour chart, Bitcoin is consolidating as buyers attempt to gather strength for a potential breach above 0,000. Traders should watch out for what plays out this week. The consolidation below 0,000 suggests indecision, but the overall bullish sentiment remains intact. If buyers successfully breach the 0,000 resistance level, Bitcoin could see a sharp rally, with the next potential targets being 5,000 and 0,000. However, failure to break above could lead to a retracement toward ,180 or lower support zones. https://www.tradingview.com/x/Ht7Ie2nD/ https://www.tradingview.com/x/rXDUtWm1/ Lucky Block Price Forecast - LBLOCKUSD Pauses Bullish Momentum Amid Strategic Retreat Lucky Block Price Forecast - December 10th Lucky Block price forecast is for buyers to recover strength. Lucky Block Long Term Trend: Bullish (Daily Chart) Key Levels: Support Zones: <img width=.00001730, https://www.tradingview.com/x/jow8x2Cp/ . Bitcoin Holds Ground as Bulls Aim for $100,000 Breakout BTCUSD bulls continue to fight for expansion Bitcoin continues to trade below the $100,000 key resistance level as bullish forces maintain dominance despite increasing pressure. The crypto market remains resilient, but buyers are struggling to push beyond the psychological barrier. BTCUSD Key Levels Resistance: $100,000, 97,000 Support: $91,180, $81000 Bitcoin has shown consistent bullish momentum throughout Q4 of 2024, marking one of the strongest quarters in recent years. After achieving a new all-time high earlier this quarter, the bullish market has faced headwinds, with price consolidating below the $100,000 level. The prolonged consolidation suggests that buyers are encountering resistance but remain committed to maintaining dominance. The market currently trades within a tight range, hinting at an impending breakout or breakdown depending on buyer and seller strength. The Stochastic Oscillator shows a gradual decline in bullish strength, reflecting the consolidation phase. The Momentum Indicator has flattened, indicating reduced market activity and signaling a need for renewed momentum to drive a breakout. Market Expectation On the 4-hour chart, Bitcoin is consolidating as buyers attempt to gather strength for a potential breach above $100,000. Traders should watch out for what plays out this week. The consolidation below $100,000 suggests indecision, but the overall bullish sentiment remains intact. If buyers successfully breach the $100,000 resistance level, Bitcoin could see a sharp rally, with the next potential targets being $105,000 and $110,000. However, failure to break above could lead to a retracement toward $91,180 or lower support zones. https://www.tradingview.com/x/Ht7Ie2nD/ https://www.tradingview.com/x/rXDUtWm1/ Lucky Block Price Forecast - LBLOCKUSD Pauses Bullish Momentum Amid Strategic Retreat Lucky Block Price Forecast - December 10th Lucky Block price forecast is for buyers to recover strength. Lucky Block Long Term Trend: Bullish (Daily Chart) Key Levels: Support Zones: $0.00001730, $0.00001600 Resistance Zones: $0.00001940, $0.00002150 Lucky Block has witnessed a retracement, breaking below the $0.00001940 significant level as buyers opt for a strategic pause. After several days of bullish momentum, this pullback appears to be a consolidation phase rather than a complete loss of control by the buyers. The current market slowdown suggests an opportunity for accumulation before a potential rebound. Lucky Block Price Forecast - LBLOCKUSD Outlook The market's recent pullback aligns with the concept of a bullish retracement within a larger uptrend. The $0.00001730 level is a critical bullish mitigation block, where buyers may step in to regain strength. A deeper retracement to $0.00001600 could provide a high-probability zone for a renewed push higher. The indicator shows a decline toward the mid-region, signaling weakening bullish momentum. However, this movement often aligns with temporary pullbacks, providing buyers with a better entry point. The MACD MACD (Moving Average Convergence and Divergence) remains above the zero line; its current decline reflects a slowdown in bullish pressure. This suggests that the market is temporarily favoring sellers but still maintains the potential for a rebound. Lucky Block Medium (4-Hour Chart) The short time frame reveals a controlled drop in price, reflecting a temporary dominance of sellers. Buyers are likely watching for the price to settle near the $0.00001730 support level to regain momentum. The short-term Stochastic Oscillator and MACD confirm bearish control as the price approaches a critical support zone. Despite the retracement, buyers remain poised to re-enter, especially as the $0.00001730 level acts as a strong liquidity pool. https://www.tradingview.com/x/KtyPac6d/ https://www.tradingview.com/x/oSH68qzo/ Two 4hrs chart https://www.tradingview.com/x/Jm6lMD6D/ Toncoin Price Forecast - TONUSD Buyers Attempt Recovery Amid Bearish Pressure.00001600 Resistance Zones: https://www.tradingview.com/x/jow8x2Cp/ . Bitcoin Holds Ground as Bulls Aim for $100,000 Breakout BTCUSD bulls continue to fight for expansion Bitcoin continues to trade below the $100,000 key resistance level as bullish forces maintain dominance despite increasing pressure. The crypto market remains resilient, but buyers are struggling to push beyond the psychological barrier. BTCUSD Key Levels Resistance: $100,000, 97,000 Support: $91,180, $81000 Bitcoin has shown consistent bullish momentum throughout Q4 of 2024, marking one of the strongest quarters in recent years. After achieving a new all-time high earlier this quarter, the bullish market has faced headwinds, with price consolidating below the $100,000 level. The prolonged consolidation suggests that buyers are encountering resistance but remain committed to maintaining dominance. The market currently trades within a tight range, hinting at an impending breakout or breakdown depending on buyer and seller strength. The Stochastic Oscillator shows a gradual decline in bullish strength, reflecting the consolidation phase. The Momentum Indicator has flattened, indicating reduced market activity and signaling a need for renewed momentum to drive a breakout. Market Expectation On the 4-hour chart, Bitcoin is consolidating as buyers attempt to gather strength for a potential breach above $100,000. Traders should watch out for what plays out this week. The consolidation below $100,000 suggests indecision, but the overall bullish sentiment remains intact. If buyers successfully breach the $100,000 resistance level, Bitcoin could see a sharp rally, with the next potential targets being $105,000 and $110,000. However, failure to break above could lead to a retracement toward $91,180 or lower support zones. https://www.tradingview.com/x/Ht7Ie2nD/ https://www.tradingview.com/x/rXDUtWm1/ Lucky Block Price Forecast - LBLOCKUSD Pauses Bullish Momentum Amid Strategic Retreat Lucky Block Price Forecast - December 10th Lucky Block price forecast is for buyers to recover strength. Lucky Block Long Term Trend: Bullish (Daily Chart) Key Levels: Support Zones: $0.00001730, $0.00001600 Resistance Zones: $0.00001940, $0.00002150 Lucky Block has witnessed a retracement, breaking below the $0.00001940 significant level as buyers opt for a strategic pause. After several days of bullish momentum, this pullback appears to be a consolidation phase rather than a complete loss of control by the buyers. The current market slowdown suggests an opportunity for accumulation before a potential rebound. Lucky Block Price Forecast - LBLOCKUSD Outlook The market's recent pullback aligns with the concept of a bullish retracement within a larger uptrend. The $0.00001730 level is a critical bullish mitigation block, where buyers may step in to regain strength. A deeper retracement to $0.00001600 could provide a high-probability zone for a renewed push higher. The indicator shows a decline toward the mid-region, signaling weakening bullish momentum. However, this movement often aligns with temporary pullbacks, providing buyers with a better entry point. The MACD MACD (Moving Average Convergence and Divergence) remains above the zero line; its current decline reflects a slowdown in bullish pressure. This suggests that the market is temporarily favoring sellers but still maintains the potential for a rebound. Lucky Block Medium (4-Hour Chart) The short time frame reveals a controlled drop in price, reflecting a temporary dominance of sellers. Buyers are likely watching for the price to settle near the $0.00001730 support level to regain momentum. The short-term Stochastic Oscillator and MACD confirm bearish control as the price approaches a critical support zone. Despite the retracement, buyers remain poised to re-enter, especially as the $0.00001730 level acts as a strong liquidity pool. https://www.tradingview.com/x/KtyPac6d/ https://www.tradingview.com/x/oSH68qzo/ Two 4hrs chart https://www.tradingview.com/x/Jm6lMD6D/ Toncoin Price Forecast - TONUSD Buyers Attempt Recovery Amid Bearish Pressure.00001940, https://www.tradingview.com/x/jow8x2Cp/ . Bitcoin Holds Ground as Bulls Aim for $100,000 Breakout BTCUSD bulls continue to fight for expansion Bitcoin continues to trade below the $100,000 key resistance level as bullish forces maintain dominance despite increasing pressure. The crypto market remains resilient, but buyers are struggling to push beyond the psychological barrier. BTCUSD Key Levels Resistance: $100,000, 97,000 Support: $91,180, $81000 Bitcoin has shown consistent bullish momentum throughout Q4 of 2024, marking one of the strongest quarters in recent years. After achieving a new all-time high earlier this quarter, the bullish market has faced headwinds, with price consolidating below the $100,000 level. The prolonged consolidation suggests that buyers are encountering resistance but remain committed to maintaining dominance. The market currently trades within a tight range, hinting at an impending breakout or breakdown depending on buyer and seller strength. The Stochastic Oscillator shows a gradual decline in bullish strength, reflecting the consolidation phase. The Momentum Indicator has flattened, indicating reduced market activity and signaling a need for renewed momentum to drive a breakout. Market Expectation On the 4-hour chart, Bitcoin is consolidating as buyers attempt to gather strength for a potential breach above $100,000. Traders should watch out for what plays out this week. The consolidation below $100,000 suggests indecision, but the overall bullish sentiment remains intact. If buyers successfully breach the $100,000 resistance level, Bitcoin could see a sharp rally, with the next potential targets being $105,000 and $110,000. However, failure to break above could lead to a retracement toward $91,180 or lower support zones. https://www.tradingview.com/x/Ht7Ie2nD/ https://www.tradingview.com/x/rXDUtWm1/ Lucky Block Price Forecast - LBLOCKUSD Pauses Bullish Momentum Amid Strategic Retreat Lucky Block Price Forecast - December 10th Lucky Block price forecast is for buyers to recover strength. Lucky Block Long Term Trend: Bullish (Daily Chart) Key Levels: Support Zones: $0.00001730, $0.00001600 Resistance Zones: $0.00001940, $0.00002150 Lucky Block has witnessed a retracement, breaking below the $0.00001940 significant level as buyers opt for a strategic pause. After several days of bullish momentum, this pullback appears to be a consolidation phase rather than a complete loss of control by the buyers. The current market slowdown suggests an opportunity for accumulation before a potential rebound. Lucky Block Price Forecast - LBLOCKUSD Outlook The market's recent pullback aligns with the concept of a bullish retracement within a larger uptrend. The $0.00001730 level is a critical bullish mitigation block, where buyers may step in to regain strength. A deeper retracement to $0.00001600 could provide a high-probability zone for a renewed push higher. The indicator shows a decline toward the mid-region, signaling weakening bullish momentum. However, this movement often aligns with temporary pullbacks, providing buyers with a better entry point. The MACD MACD (Moving Average Convergence and Divergence) remains above the zero line; its current decline reflects a slowdown in bullish pressure. This suggests that the market is temporarily favoring sellers but still maintains the potential for a rebound. Lucky Block Medium (4-Hour Chart) The short time frame reveals a controlled drop in price, reflecting a temporary dominance of sellers. Buyers are likely watching for the price to settle near the $0.00001730 support level to regain momentum. The short-term Stochastic Oscillator and MACD confirm bearish control as the price approaches a critical support zone. Despite the retracement, buyers remain poised to re-enter, especially as the $0.00001730 level acts as a strong liquidity pool. https://www.tradingview.com/x/KtyPac6d/ https://www.tradingview.com/x/oSH68qzo/ Two 4hrs chart https://www.tradingview.com/x/Jm6lMD6D/ Toncoin Price Forecast - TONUSD Buyers Attempt Recovery Amid Bearish Pressure.00002150 Lucky Block has witnessed a retracement, breaking below the https://www.tradingview.com/x/jow8x2Cp/ . Bitcoin Holds Ground as Bulls Aim for $100,000 Breakout BTCUSD bulls continue to fight for expansion Bitcoin continues to trade below the $100,000 key resistance level as bullish forces maintain dominance despite increasing pressure. The crypto market remains resilient, but buyers are struggling to push beyond the psychological barrier. BTCUSD Key Levels Resistance: $100,000, 97,000 Support: $91,180, $81000 Bitcoin has shown consistent bullish momentum throughout Q4 of 2024, marking one of the strongest quarters in recent years. After achieving a new all-time high earlier this quarter, the bullish market has faced headwinds, with price consolidating below the $100,000 level. The prolonged consolidation suggests that buyers are encountering resistance but remain committed to maintaining dominance. The market currently trades within a tight range, hinting at an impending breakout or breakdown depending on buyer and seller strength. The Stochastic Oscillator shows a gradual decline in bullish strength, reflecting the consolidation phase. The Momentum Indicator has flattened, indicating reduced market activity and signaling a need for renewed momentum to drive a breakout. Market Expectation On the 4-hour chart, Bitcoin is consolidating as buyers attempt to gather strength for a potential breach above $100,000. Traders should watch out for what plays out this week. The consolidation below $100,000 suggests indecision, but the overall bullish sentiment remains intact. If buyers successfully breach the $100,000 resistance level, Bitcoin could see a sharp rally, with the next potential targets being $105,000 and $110,000. However, failure to break above could lead to a retracement toward $91,180 or lower support zones. https://www.tradingview.com/x/Ht7Ie2nD/ https://www.tradingview.com/x/rXDUtWm1/ Lucky Block Price Forecast - LBLOCKUSD Pauses Bullish Momentum Amid Strategic Retreat Lucky Block Price Forecast - December 10th Lucky Block price forecast is for buyers to recover strength. Lucky Block Long Term Trend: Bullish (Daily Chart) Key Levels: Support Zones: $0.00001730, $0.00001600 Resistance Zones: $0.00001940, $0.00002150 Lucky Block has witnessed a retracement, breaking below the $0.00001940 significant level as buyers opt for a strategic pause. After several days of bullish momentum, this pullback appears to be a consolidation phase rather than a complete loss of control by the buyers. The current market slowdown suggests an opportunity for accumulation before a potential rebound. Lucky Block Price Forecast - LBLOCKUSD Outlook The market's recent pullback aligns with the concept of a bullish retracement within a larger uptrend. The $0.00001730 level is a critical bullish mitigation block, where buyers may step in to regain strength. A deeper retracement to $0.00001600 could provide a high-probability zone for a renewed push higher. The indicator shows a decline toward the mid-region, signaling weakening bullish momentum. However, this movement often aligns with temporary pullbacks, providing buyers with a better entry point. The MACD MACD (Moving Average Convergence and Divergence) remains above the zero line; its current decline reflects a slowdown in bullish pressure. This suggests that the market is temporarily favoring sellers but still maintains the potential for a rebound. Lucky Block Medium (4-Hour Chart) The short time frame reveals a controlled drop in price, reflecting a temporary dominance of sellers. Buyers are likely watching for the price to settle near the $0.00001730 support level to regain momentum. The short-term Stochastic Oscillator and MACD confirm bearish control as the price approaches a critical support zone. Despite the retracement, buyers remain poised to re-enter, especially as the $0.00001730 level acts as a strong liquidity pool. https://www.tradingview.com/x/KtyPac6d/ https://www.tradingview.com/x/oSH68qzo/ Two 4hrs chart https://www.tradingview.com/x/Jm6lMD6D/ Toncoin Price Forecast - TONUSD Buyers Attempt Recovery Amid Bearish Pressure.00001940 significant level as buyers opt for a strategic pause. After several days of bullish momentum, this pullback appears to be a consolidation phase rather than a complete loss of control by the buyers. The current market slowdown suggests an opportunity for accumulation before a potential rebound. Lucky Block Price Forecast - LBLOCKUSD Outlook The market's recent pullback aligns with the concept of a bullish retracement within a larger uptrend. The https://www.tradingview.com/x/jow8x2Cp/ . Bitcoin Holds Ground as Bulls Aim for $100,000 Breakout BTCUSD bulls continue to fight for expansion Bitcoin continues to trade below the $100,000 key resistance level as bullish forces maintain dominance despite increasing pressure. The crypto market remains resilient, but buyers are struggling to push beyond the psychological barrier. BTCUSD Key Levels Resistance: $100,000, 97,000 Support: $91,180, $81000 Bitcoin has shown consistent bullish momentum throughout Q4 of 2024, marking one of the strongest quarters in recent years. After achieving a new all-time high earlier this quarter, the bullish market has faced headwinds, with price consolidating below the $100,000 level. The prolonged consolidation suggests that buyers are encountering resistance but remain committed to maintaining dominance. The market currently trades within a tight range, hinting at an impending breakout or breakdown depending on buyer and seller strength. The Stochastic Oscillator shows a gradual decline in bullish strength, reflecting the consolidation phase. The Momentum Indicator has flattened, indicating reduced market activity and signaling a need for renewed momentum to drive a breakout. Market Expectation On the 4-hour chart, Bitcoin is consolidating as buyers attempt to gather strength for a potential breach above $100,000. Traders should watch out for what plays out this week. The consolidation below $100,000 suggests indecision, but the overall bullish sentiment remains intact. If buyers successfully breach the $100,000 resistance level, Bitcoin could see a sharp rally, with the next potential targets being $105,000 and $110,000. However, failure to break above could lead to a retracement toward $91,180 or lower support zones. https://www.tradingview.com/x/Ht7Ie2nD/ https://www.tradingview.com/x/rXDUtWm1/ Lucky Block Price Forecast - LBLOCKUSD Pauses Bullish Momentum Amid Strategic Retreat Lucky Block Price Forecast - December 10th Lucky Block price forecast is for buyers to recover strength. Lucky Block Long Term Trend: Bullish (Daily Chart) Key Levels: Support Zones: $0.00001730, $0.00001600 Resistance Zones: $0.00001940, $0.00002150 Lucky Block has witnessed a retracement, breaking below the $0.00001940 significant level as buyers opt for a strategic pause. After several days of bullish momentum, this pullback appears to be a consolidation phase rather than a complete loss of control by the buyers. The current market slowdown suggests an opportunity for accumulation before a potential rebound. Lucky Block Price Forecast - LBLOCKUSD Outlook The market's recent pullback aligns with the concept of a bullish retracement within a larger uptrend. The $0.00001730 level is a critical bullish mitigation block, where buyers may step in to regain strength. A deeper retracement to $0.00001600 could provide a high-probability zone for a renewed push higher. The indicator shows a decline toward the mid-region, signaling weakening bullish momentum. However, this movement often aligns with temporary pullbacks, providing buyers with a better entry point. The MACD MACD (Moving Average Convergence and Divergence) remains above the zero line; its current decline reflects a slowdown in bullish pressure. This suggests that the market is temporarily favoring sellers but still maintains the potential for a rebound. Lucky Block Medium (4-Hour Chart) The short time frame reveals a controlled drop in price, reflecting a temporary dominance of sellers. Buyers are likely watching for the price to settle near the $0.00001730 support level to regain momentum. The short-term Stochastic Oscillator and MACD confirm bearish control as the price approaches a critical support zone. Despite the retracement, buyers remain poised to re-enter, especially as the $0.00001730 level acts as a strong liquidity pool. https://www.tradingview.com/x/KtyPac6d/ https://www.tradingview.com/x/oSH68qzo/ Two 4hrs chart https://www.tradingview.com/x/Jm6lMD6D/ Toncoin Price Forecast - TONUSD Buyers Attempt Recovery Amid Bearish Pressure.00001730 level is a critical bullish mitigation block, where buyers may step in to regain strength. A deeper retracement to https://www.tradingview.com/x/jow8x2Cp/ . Bitcoin Holds Ground as Bulls Aim for $100,000 Breakout BTCUSD bulls continue to fight for expansion Bitcoin continues to trade below the $100,000 key resistance level as bullish forces maintain dominance despite increasing pressure. The crypto market remains resilient, but buyers are struggling to push beyond the psychological barrier. BTCUSD Key Levels Resistance: $100,000, 97,000 Support: $91,180, $81000 Bitcoin has shown consistent bullish momentum throughout Q4 of 2024, marking one of the strongest quarters in recent years. After achieving a new all-time high earlier this quarter, the bullish market has faced headwinds, with price consolidating below the $100,000 level. The prolonged consolidation suggests that buyers are encountering resistance but remain committed to maintaining dominance. The market currently trades within a tight range, hinting at an impending breakout or breakdown depending on buyer and seller strength. The Stochastic Oscillator shows a gradual decline in bullish strength, reflecting the consolidation phase. The Momentum Indicator has flattened, indicating reduced market activity and signaling a need for renewed momentum to drive a breakout. Market Expectation On the 4-hour chart, Bitcoin is consolidating as buyers attempt to gather strength for a potential breach above $100,000. Traders should watch out for what plays out this week. The consolidation below $100,000 suggests indecision, but the overall bullish sentiment remains intact. If buyers successfully breach the $100,000 resistance level, Bitcoin could see a sharp rally, with the next potential targets being $105,000 and $110,000. However, failure to break above could lead to a retracement toward $91,180 or lower support zones. https://www.tradingview.com/x/Ht7Ie2nD/ https://www.tradingview.com/x/rXDUtWm1/ Lucky Block Price Forecast - LBLOCKUSD Pauses Bullish Momentum Amid Strategic Retreat Lucky Block Price Forecast - December 10th Lucky Block price forecast is for buyers to recover strength. Lucky Block Long Term Trend: Bullish (Daily Chart) Key Levels: Support Zones: $0.00001730, $0.00001600 Resistance Zones: $0.00001940, $0.00002150 Lucky Block has witnessed a retracement, breaking below the $0.00001940 significant level as buyers opt for a strategic pause. After several days of bullish momentum, this pullback appears to be a consolidation phase rather than a complete loss of control by the buyers. The current market slowdown suggests an opportunity for accumulation before a potential rebound. Lucky Block Price Forecast - LBLOCKUSD Outlook The market's recent pullback aligns with the concept of a bullish retracement within a larger uptrend. The $0.00001730 level is a critical bullish mitigation block, where buyers may step in to regain strength. A deeper retracement to $0.00001600 could provide a high-probability zone for a renewed push higher. The indicator shows a decline toward the mid-region, signaling weakening bullish momentum. However, this movement often aligns with temporary pullbacks, providing buyers with a better entry point. The MACD MACD (Moving Average Convergence and Divergence) remains above the zero line; its current decline reflects a slowdown in bullish pressure. This suggests that the market is temporarily favoring sellers but still maintains the potential for a rebound. Lucky Block Medium (4-Hour Chart) The short time frame reveals a controlled drop in price, reflecting a temporary dominance of sellers. Buyers are likely watching for the price to settle near the $0.00001730 support level to regain momentum. The short-term Stochastic Oscillator and MACD confirm bearish control as the price approaches a critical support zone. Despite the retracement, buyers remain poised to re-enter, especially as the $0.00001730 level acts as a strong liquidity pool. https://www.tradingview.com/x/KtyPac6d/ https://www.tradingview.com/x/oSH68qzo/ Two 4hrs chart https://www.tradingview.com/x/Jm6lMD6D/ Toncoin Price Forecast - TONUSD Buyers Attempt Recovery Amid Bearish Pressure.00001600 could provide a high-probability zone for a renewed push higher. The indicator shows a decline toward the mid-region, signaling weakening bullish momentum. However, this movement often aligns with temporary pullbacks, providing buyers with a better entry point. The MACD MACD (Moving Average Convergence and Divergence) remains above the zero line; its current decline reflects a slowdown in bullish pressure. This suggests that the market is temporarily favoring sellers but still maintains the potential for a rebound. Lucky Block Medium (4-Hour Chart) The short time frame reveals a controlled drop in price, reflecting a temporary dominance of sellers. Buyers are likely watching for the price to settle near the https://www.tradingview.com/x/jow8x2Cp/ . Bitcoin Holds Ground as Bulls Aim for $100,000 Breakout BTCUSD bulls continue to fight for expansion Bitcoin continues to trade below the $100,000 key resistance level as bullish forces maintain dominance despite increasing pressure. The crypto market remains resilient, but buyers are struggling to push beyond the psychological barrier. BTCUSD Key Levels Resistance: $100,000, 97,000 Support: $91,180, $81000 Bitcoin has shown consistent bullish momentum throughout Q4 of 2024, marking one of the strongest quarters in recent years. After achieving a new all-time high earlier this quarter, the bullish market has faced headwinds, with price consolidating below the $100,000 level. The prolonged consolidation suggests that buyers are encountering resistance but remain committed to maintaining dominance. The market currently trades within a tight range, hinting at an impending breakout or breakdown depending on buyer and seller strength. The Stochastic Oscillator shows a gradual decline in bullish strength, reflecting the consolidation phase. The Momentum Indicator has flattened, indicating reduced market activity and signaling a need for renewed momentum to drive a breakout. Market Expectation On the 4-hour chart, Bitcoin is consolidating as buyers attempt to gather strength for a potential breach above $100,000. Traders should watch out for what plays out this week. The consolidation below $100,000 suggests indecision, but the overall bullish sentiment remains intact. If buyers successfully breach the $100,000 resistance level, Bitcoin could see a sharp rally, with the next potential targets being $105,000 and $110,000. However, failure to break above could lead to a retracement toward $91,180 or lower support zones. https://www.tradingview.com/x/Ht7Ie2nD/ https://www.tradingview.com/x/rXDUtWm1/ Lucky Block Price Forecast - LBLOCKUSD Pauses Bullish Momentum Amid Strategic Retreat Lucky Block Price Forecast - December 10th Lucky Block price forecast is for buyers to recover strength. Lucky Block Long Term Trend: Bullish (Daily Chart) Key Levels: Support Zones: $0.00001730, $0.00001600 Resistance Zones: $0.00001940, $0.00002150 Lucky Block has witnessed a retracement, breaking below the $0.00001940 significant level as buyers opt for a strategic pause. After several days of bullish momentum, this pullback appears to be a consolidation phase rather than a complete loss of control by the buyers. The current market slowdown suggests an opportunity for accumulation before a potential rebound. Lucky Block Price Forecast - LBLOCKUSD Outlook The market's recent pullback aligns with the concept of a bullish retracement within a larger uptrend. The $0.00001730 level is a critical bullish mitigation block, where buyers may step in to regain strength. A deeper retracement to $0.00001600 could provide a high-probability zone for a renewed push higher. The indicator shows a decline toward the mid-region, signaling weakening bullish momentum. However, this movement often aligns with temporary pullbacks, providing buyers with a better entry point. The MACD MACD (Moving Average Convergence and Divergence) remains above the zero line; its current decline reflects a slowdown in bullish pressure. This suggests that the market is temporarily favoring sellers but still maintains the potential for a rebound. Lucky Block Medium (4-Hour Chart) The short time frame reveals a controlled drop in price, reflecting a temporary dominance of sellers. Buyers are likely watching for the price to settle near the $0.00001730 support level to regain momentum. The short-term Stochastic Oscillator and MACD confirm bearish control as the price approaches a critical support zone. Despite the retracement, buyers remain poised to re-enter, especially as the $0.00001730 level acts as a strong liquidity pool. https://www.tradingview.com/x/KtyPac6d/ https://www.tradingview.com/x/oSH68qzo/ Two 4hrs chart https://www.tradingview.com/x/Jm6lMD6D/ Toncoin Price Forecast - TONUSD Buyers Attempt Recovery Amid Bearish Pressure.00001730 support level to regain momentum. The short-term Stochastic Oscillator and MACD confirm bearish control as the price approaches a critical support zone. Despite the retracement, buyers remain poised to re-enter, especially as the https://www.tradingview.com/x/jow8x2Cp/ . Bitcoin Holds Ground as Bulls Aim for $100,000 Breakout BTCUSD bulls continue to fight for expansion Bitcoin continues to trade below the $100,000 key resistance level as bullish forces maintain dominance despite increasing pressure. The crypto market remains resilient, but buyers are struggling to push beyond the psychological barrier. BTCUSD Key Levels Resistance: $100,000, 97,000 Support: $91,180, $81000 Bitcoin has shown consistent bullish momentum throughout Q4 of 2024, marking one of the strongest quarters in recent years. After achieving a new all-time high earlier this quarter, the bullish market has faced headwinds, with price consolidating below the $100,000 level. The prolonged consolidation suggests that buyers are encountering resistance but remain committed to maintaining dominance. The market currently trades within a tight range, hinting at an impending breakout or breakdown depending on buyer and seller strength. The Stochastic Oscillator shows a gradual decline in bullish strength, reflecting the consolidation phase. The Momentum Indicator has flattened, indicating reduced market activity and signaling a need for renewed momentum to drive a breakout. Market Expectation On the 4-hour chart, Bitcoin is consolidating as buyers attempt to gather strength for a potential breach above $100,000. Traders should watch out for what plays out this week. The consolidation below $100,000 suggests indecision, but the overall bullish sentiment remains intact. If buyers successfully breach the $100,000 resistance level, Bitcoin could see a sharp rally, with the next potential targets being $105,000 and $110,000. However, failure to break above could lead to a retracement toward $91,180 or lower support zones. https://www.tradingview.com/x/Ht7Ie2nD/ https://www.tradingview.com/x/rXDUtWm1/ Lucky Block Price Forecast - LBLOCKUSD Pauses Bullish Momentum Amid Strategic Retreat Lucky Block Price Forecast - December 10th Lucky Block price forecast is for buyers to recover strength. Lucky Block Long Term Trend: Bullish (Daily Chart) Key Levels: Support Zones: $0.00001730, $0.00001600 Resistance Zones: $0.00001940, $0.00002150 Lucky Block has witnessed a retracement, breaking below the $0.00001940 significant level as buyers opt for a strategic pause. After several days of bullish momentum, this pullback appears to be a consolidation phase rather than a complete loss of control by the buyers. The current market slowdown suggests an opportunity for accumulation before a potential rebound. Lucky Block Price Forecast - LBLOCKUSD Outlook The market's recent pullback aligns with the concept of a bullish retracement within a larger uptrend. The $0.00001730 level is a critical bullish mitigation block, where buyers may step in to regain strength. A deeper retracement to $0.00001600 could provide a high-probability zone for a renewed push higher. The indicator shows a decline toward the mid-region, signaling weakening bullish momentum. However, this movement often aligns with temporary pullbacks, providing buyers with a better entry point. The MACD MACD (Moving Average Convergence and Divergence) remains above the zero line; its current decline reflects a slowdown in bullish pressure. This suggests that the market is temporarily favoring sellers but still maintains the potential for a rebound. Lucky Block Medium (4-Hour Chart) The short time frame reveals a controlled drop in price, reflecting a temporary dominance of sellers. Buyers are likely watching for the price to settle near the $0.00001730 support level to regain momentum. The short-term Stochastic Oscillator and MACD confirm bearish control as the price approaches a critical support zone. Despite the retracement, buyers remain poised to re-enter, especially as the $0.00001730 level acts as a strong liquidity pool. https://www.tradingview.com/x/KtyPac6d/ https://www.tradingview.com/x/oSH68qzo/ Two 4hrs chart https://www.tradingview.com/x/Jm6lMD6D/ Toncoin Price Forecast - TONUSD Buyers Attempt Recovery Amid Bearish Pressure.00001730 level acts as a strong liquidity pool. https://www.tradingview.com/x/KtyPac6d/ https://www.tradingview.com/x/oSH68qzo/ Two 4hrs chart https://www.tradingview.com/x/Jm6lMD6D/ Toncoin Price Forecast - TONUSD Buyers Attempt Recovery Amid Bearish Pressure" decoding="async" data-lazy-src="https://learn2.trade/wp-content/uploads/2024/12/TONUSD-1DAY-395x168.png"/>

Toncoin Price Forecast – Tonusd Buyers Attempt Recovery Amid Bearish Pressure

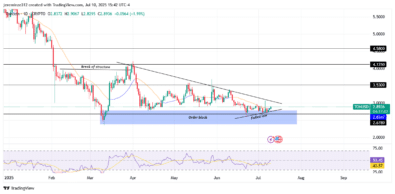
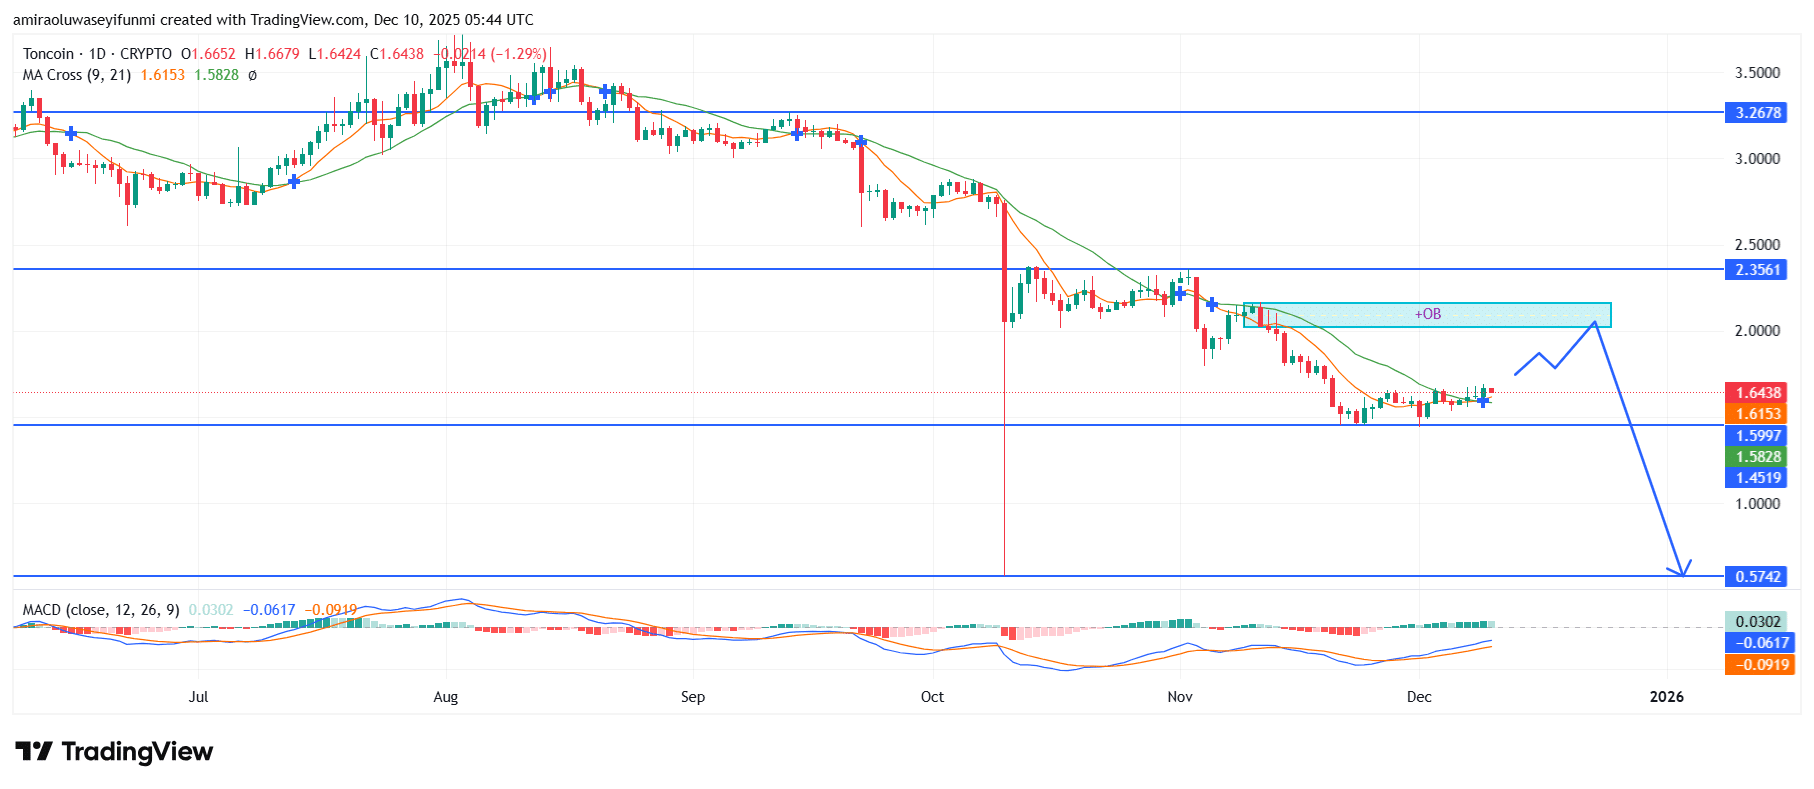
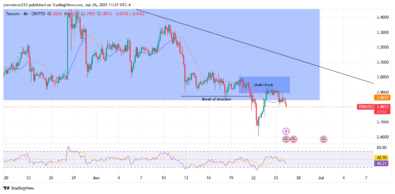
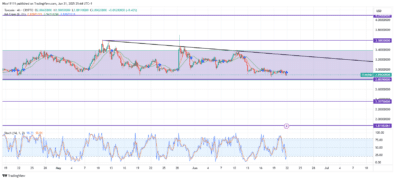
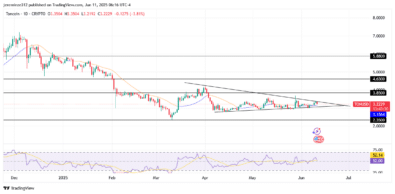
Toncoin Price Forecast – December 11 The Toncoin price forecast indicates buyers are making efforts to regain strength following a recent market downturn. Toncoin Long Term Trend: Bullish (Daily Chart)Key Levels Support Levels: $5.000, $4.500Resistance Levels: $6.000, $7.000Toncoin buyers have initiated a gradual recovery after experiencing a significant pullback in recent weeks. Following a bullish […]

Read more
Toncoin Price Forecast - TONUSD Buyers Gear Up for a Fresh Push

Toncoin Price Forecast – TONUSD Buyers Gear Up For A Fresh Push

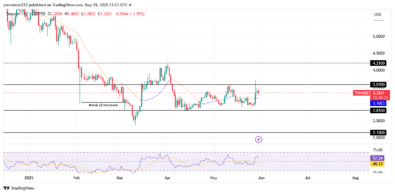
Toncoin Price Forecast – December 4th The Toncoin price forecast indicates that buyers are preparing for a more bullish run. Toncoin Long Term Trend: Bullish (Daily Chart) Support Levels: $6.800, $6.200Resistance Levels: $7.220, $7.500Toncoin buyers have maintained a steady upward trend, positioning themselves for a new challenge after breaking the critical $7.000 resistance level. The […]

Read more
TONUSD Price Forecast: Toncoin Buyers Maintain Momentum Above .1390 Key Level

TONUSD Price Forecast: Toncoin Buyers Maintain Momentum Above $6.1390 Key Level

TONUSD Price Forecast – November 28 The TONUSD price forecast indicates that the market continues to maintain a bullish outlook. TONUSD Long-Term Trend: Bullish (Daily Chart) Support Levels: $6.1390, $5.5000Resistance Levels: $6.8000, $7.5000Toncoin has strengthened above the critical $6.1390 support level, with buyers demonstrating strong commitment to sustaining control. The bullish sentiment that has been […]

Read more
TONUSD Price Forecast - Toncoin Buyers Aim to Reclaim Ground Amid Consolidation

TONUSD Price Forecast: Toncoin Buyers Seek to Regain Momentum Amid Consolidation

TONUSD Price Forecast – November 20 The Toncoin price forecast reveals the market’s struggle to regain bullish momentum as it consolidates around the critical $5.400 level. TONUSD Long-Term Trend: Bullish (Daily Chart) Support Levels: $4.7800, $4.300 Resistance Levels: $5.780, $6.120 Since the beginning of the month, TONUSD buyers have shown steady activity, but the bullish […]

Read more
Toncoin Price Forecast: Buyers Push for Control at .400 Resistance Level

Toncoin Price Forecast: Buyers Push for Control at $5.400 Resistance Level

Toncoin Price Forecast – November 13 The Toncoin price forecast indicates strong bullish momentum as buyers target a breakthrough at the $5.400 resistance level. TONUSD Long-Term Trend: Bullish (Daily Chart) Support Levels: $5.150, $4.900 Resistance Levels: $5.400, $5.710 This month, the TONUSD cryptocurrency market has witnessed a significant recovery, with buyers stepping in after Toncoin […]

Read more
Toncoin Price Forecast - TONUSD Struggles Amidst Selling Pressure, Buyers Attempt a Comeback

Toncoin Price Forecast – TONUSD Struggles Under Selling Pressure, Buyers Attempt a Comeback

Toncoin Price Forecast – November 6th The Toncoin price forecast indicates that sellers are still in control, although recent buyer interest hints at a potential shift in momentum. TONUSD Long Term Trend: Bearish (Daily Chart) Key Levels Support Levels: $2.900, $4.480 Resistance Levels: $6.300, $5.500 This week, buyers managed to lift prices to the $4.900 […]

Read more
TONUSD Price Forecast- Toncoin Sellers Gain Momentum Amid Downward Pressure

Toncoin Price Forecast- TONUSD Sellers Gain Momentum Amid Downward Pressure

Toncoin price forecast– October 31st Toncoin price forecast shows the market continues to face intense selling pressure as the bearish sentiment dominates the market, driving prices below critical support levels. TONUSD Long-Term Trend: Bearish (Daily Chart)Key Levels Resistance Levels: $5.160, $5.500Support Levels: $4.470, $4.200Since hitting resistance at $5.160, Toncoin crypto has struggled to maintain upward […]

Read more
Toncoin Price Forecast: TONUSD Consolidation Persists Below .410 Key Level

Toncoin Price Forecast: TONUSD Consolidation Persists Below $5.410 Key Level

Toncoin Price Forecast – October 23rd The Toncoin price forecast reveals that consolidation continues beneath the significant $5.410 level, with minimal movement in the market since the start of the month. TONUSD Long-Term Trend: Bearish (Daily Chart)Key Levels Resistance Levels: $5.410, $6.140Support Levels: $5.000, $4.750Buyers have struggled to regain control, unable to push the price […]

Read more
Toncoin Price Forecast: TONUSD Struggles Under Bearish Pressure, Buyers Seek to Reclaim Control

Toncoin Price Forecast: TONUSD Struggles Under Bearish Pressure, Buyers Seek to Reclaim Control

Toncoin Price Forecast – October 16th The Toncoin price forecast indicates the market is encountering strong resistance as sellers maintain control around the $5.190 level, exerting pressure on buyers attempting to break through. TONUSD Long-Term Trend: Bearish (Daily Chart) Key Levels Support Levels: $5.190, $4.470 Resistance Levels: $5.410, $6.140 The Toncoin crypto began the month […]

Read more
1 2 3 4 10
telegram
Telegram
forex
Forex
crypto
Crypto
algo
Algo
news
News