AUDJPY has more tendency for downside movement if it breaks out from its current consolidation. The price is skewed to the lower part of the consolidation. Therefore, the price crashes several times to the support level at 92.930 rather than testing the resistance at 92.620.
AUDJPY Significant Levels
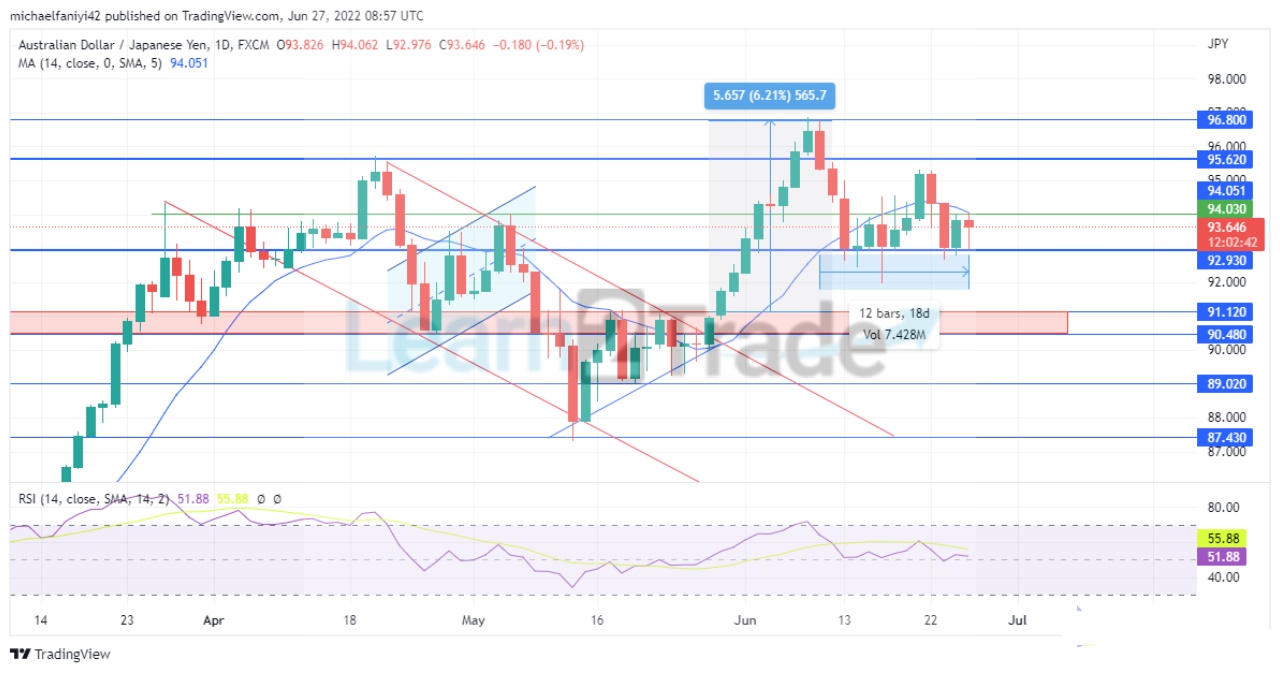
Resistance Levels: 96.800, 95.620, 94.030 Support Levels: 92.930, 91.120, 87.430
AUDJPY Long-Term Trend: Bearish
The AUDJPY market makes a breakthrough above a strong support level at 91.120. This led to a rise of more than 6% when the price reached the 96.800 resistance level. The buyers were weakened at this point and were promptly rejected. This plunged the market into a ranging movement with 92.930 as support and 95.620 as the resistance to the upward flow of the price.
The market has been ranging for up to 17 trading days now, and from all indications, the price is predisposed to trading lower. The MA period 14 (Moving Average) is now taking a resistance position above the daily candles. Notwithstanding, the RSI (Relative Strength Index) line remains above the zero level, though its undulating strength has been reduced.
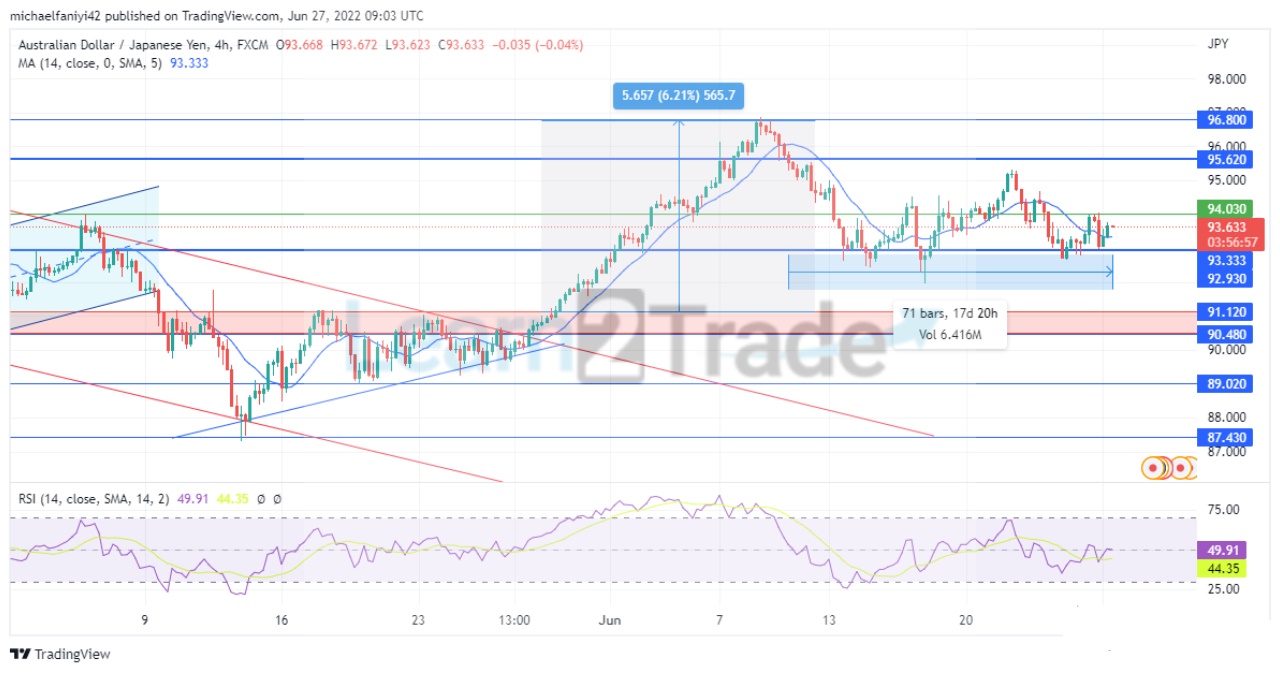
AUDJPY Short Term Trend: Bearish
On the 4-hour chart, the price is gyrating above the 92.930 support level. The MA period 14 is undulating within the 4-hour candles but is more skewed towards the support. The RSI line has dipped below the zero line and is struggling to recover above it. When AUDJPY eventually breaks below the support level, it will likely fall to 91.120.
Note:Learn2.trade is not a financial advisor. Do your research before investing your funds in any financial asset or presented product or event. We are not responsible for your investing results.
Trade on MT4 with Leverage up to 1:500! Trade on MT4 with Leverage up to 1:500!
X
We use cookies to ensure that we give you the best experience on our website. If you continue to use this site we will assume that you are happy with it.OkPrivacy policy