Key Highlights
Ethereum faces rejection at $2,600
Ether will further decline to $1,982 low
Ethereum ETH) Current Statistics
The current price: $2,444.18
Market Capitalization $284,342,517,673
Trading Volume: $24,043,095,493
Major supply zones: $2,800, $3,000, $3,200
Major demand zones: $2400,, $2,200, $2,000
Ethereum (ETH) Price Analysis June 16, 2021
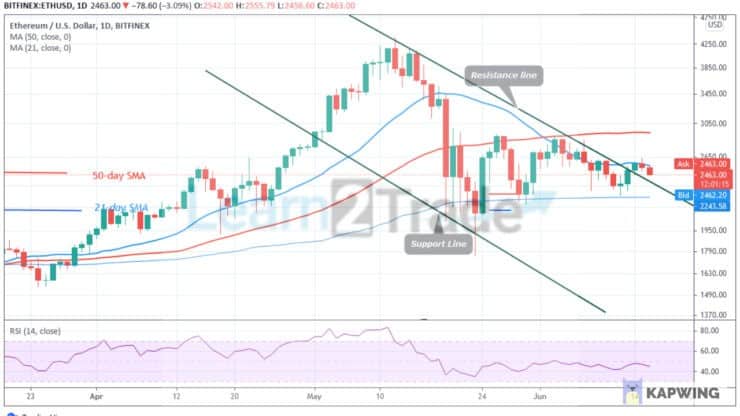
Ethereum is in a downward move. The crypto’s price has been making series of lower highs and lower lows. Buyers could not sustain the price above the lower high of $2,600. Consequently, the market has begun to resume downward. In the lower time frame, Ether’s price has broken below the moving averages. The crypto is expected to fall to the previous low.
ETH Technical Indicators Reading
The crypto’s price is falling and may break below the resistance line of the descending channel. The selling pressure will resume when price breaks below the resistance line. The altcoin is at level 42 of the Relative Strength Index period 14. It indicates that the ETH is in the downtrend zone and below the centerline 50. The coin is below the 20% range of daily stochastic. It indicates that price has reached the oversold region of the market.
Conclusion
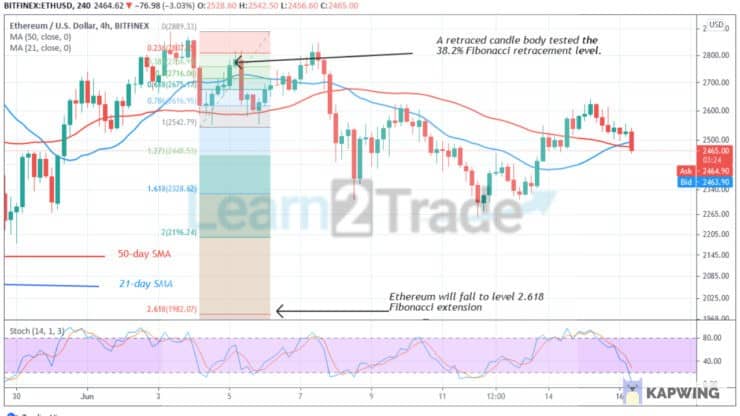
Ethereum is falling after rejection from $2,600 high. Meanwhile, on June 4 downtrend; a retraced candle body tested the 38.2% Fibonacci retracement level. The retracement indicates that Ethereum will fall to level 2.618 Fibonacci extension or level $1,982.06.
You can purchase crypto coins here: Buy Coins
Note: Learn2.Trade is not a financial advisor. Do your research before investing your funds in any financial asset or presented product or event. We are not responsible for your investing results
- Broker
- Min Deposit
- Score
- Visit Broker

- Award-winning Cryptocurrency trading platform
- $100 minimum deposit,
- FCA & Cysec regulated

- 20% welcome bonus of upto $10,000
- Minimum deposit $100
- Verify your account before the bonus is credited

- Over 100 different financial products
- Invest from as little as $10
- Same-day withdrawal is possible
- Fund Moneta Markets account with a minimum of $250
- Opt in using the form to claim your 50% deposit bonus
Learn to Trade
Never Miss A Trade Again

Signal Notification
Real-time signal notifications whenever a signal is opened, closes or Updated

Get Alerts
Immediate alerts to your email and mobile phone.

Entry Price Levels
Entry price level for every signal Just choose one of our Top Brokers in the list above to get all this free.