Don’t invest unless you’re prepared to lose all the money you invest. This is a high-risk investment and you are unlikely to be protected if something goes wrong. Take 2 minutes to learn more
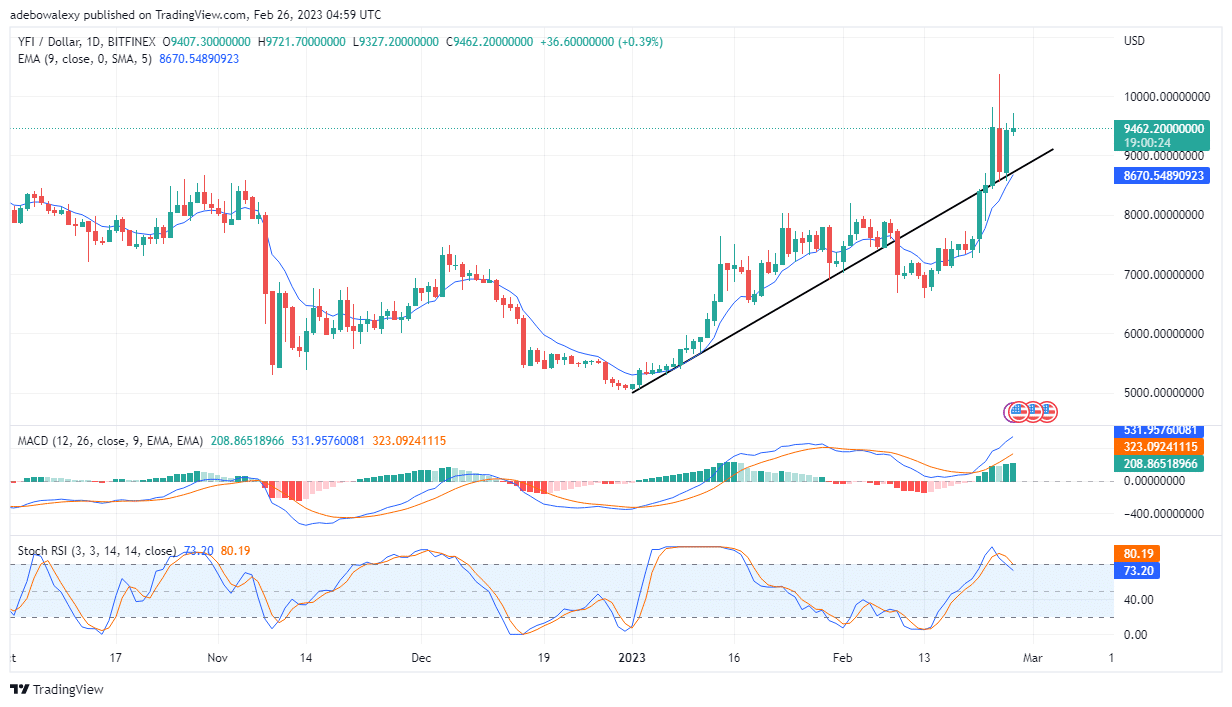
Price action in the Yearn.finance daily market seems to be ready to take on the challenge of trying to decisively break the $10,000 mark. The price of YFI/USD tested this level about two sessions ago but failed to find support above it. Consequently, the market witnessed a downward retracement toward the $8,800 price level. Without further ado, let’s zoom in to get a better view of price movements in this market.
Yearn.finance Analysis Data:
Yearn.finance value now: $9,462
YFI market cap: $348,873,686
YFI moving supply: 36,637.72
Yearn.finance Supply: 36.666
Yearn.finance Coinmarketcap ranking: #119
Major Price Levels:
Top: $9,462, $9,662 $9,850
Base: $9,340, $9,300 $9,200

Yearn.finance (YFI) Price Pumps by 8.74%
Yearn.finance Price action has ramped up by 8.74% at the early stages of a single session. Even on the daily chart, trading indicators are showing fair signs that the tailwind in this market may grow. A green price candle has just appeared for this trading session. Meanwhile, trading activities could be observed happening above the 9-day EMA, and this depicts that the price is rising. Also, the MACD indicator curves are rising, while its histogram bars have regained their greenish appearance. By implication, this reveals that the tailwind in this market may keep building up. However, it appears that it will take more effort from the bulls before the RSI indicator lines sense the market trend, as its lines are still moving slightly downward.

Yearn.finance (YFI) Stays Positive Despite a Minimal Downward Retracement
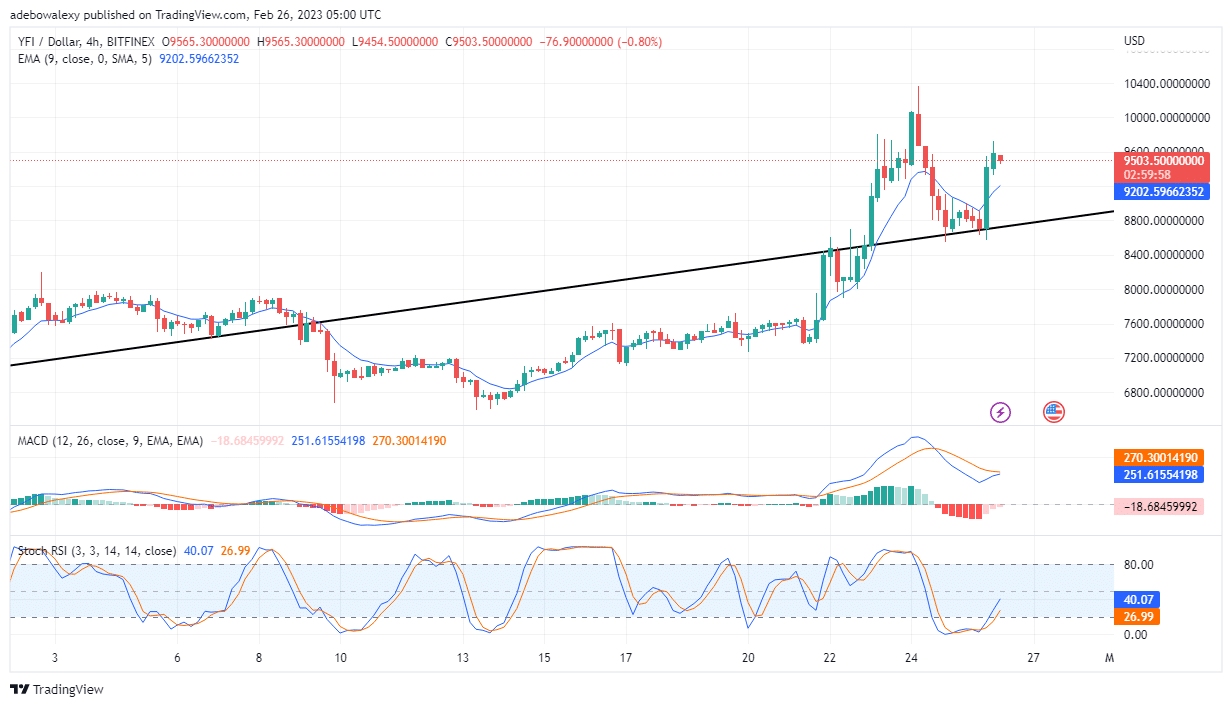
Coming to the Yearn.finance 4-hour market, it could be seen that a red-price candle has shown up on the market for the ongoing trading session. This shows that shot orders are getting triggered. However, price action remains above the 9-day EMA and the drawn upside-sloping trendline. Likewise, the RSI indicator lines keep moving upward, while the MACD indicator lines seem to be attempting a bullish crossover. Furthermore, the red histogram bars of the MACD indicator can be seen growing smaller, becoming paler in appearance, and almost disappearing into the equilibrium point. Technically, it appears that the upside momentum in this market is growing stronger, so traders can expect the YFI price to revisit the $9,800, or perhaps the $10,000 mark.
- Broker
- Min Deposit
- Score
- Visit Broker
- Award-winning Cryptocurrency trading platform
- $100 minimum deposit,
- FCA & Cysec regulated
- 20% welcome bonus of upto $10,000
- Minimum deposit $100
- Verify your account before the bonus is credited
- Fund Moneta Markets account with a minimum of $250
- Opt in using the form to claim your 50% deposit bonus
Learn to Trade
Never Miss A Trade Again

Signal Notification
Real-time signal notifications whenever a signal is opened, closes or Updated

Get Alerts
Immediate alerts to your email and mobile phone.

Entry Price Levels
Entry price level for every signal Just choose one of our Top Brokers in the list above to get all this free.


