Don’t invest unless you’re prepared to lose all the money you invest. This is a high-risk investment and you are unlikely to be protected if something goes wrong. Take 2 minutes to learn more
Yearn.finance (YFI) price action has held on to the 2nd spot on the daily crypto mover’s list for about three days in a row. Also, price action in this market has been breaking multiple price resistance levels. At this point, this crypto is about to hit the $10,000 mark. Without further ado, let’s give this market a more careful and thoughtful examination.
Yearn.finance Analysis Data:
Yearn.finance value now: $9,984
YFI market cap: $$361,556,883
YFI moving supply: 36,637.72
Yearn.finance Supply: 36.666
Yearn.finance Coinmarketcap ranking: #121
Major Price Levels:
Top: $9,984, $10,112 $10,224
Base: $9,884, $9,750 $9,500

Yearn.finance (YFI) Prepares to Break the $10,000 Price Mark
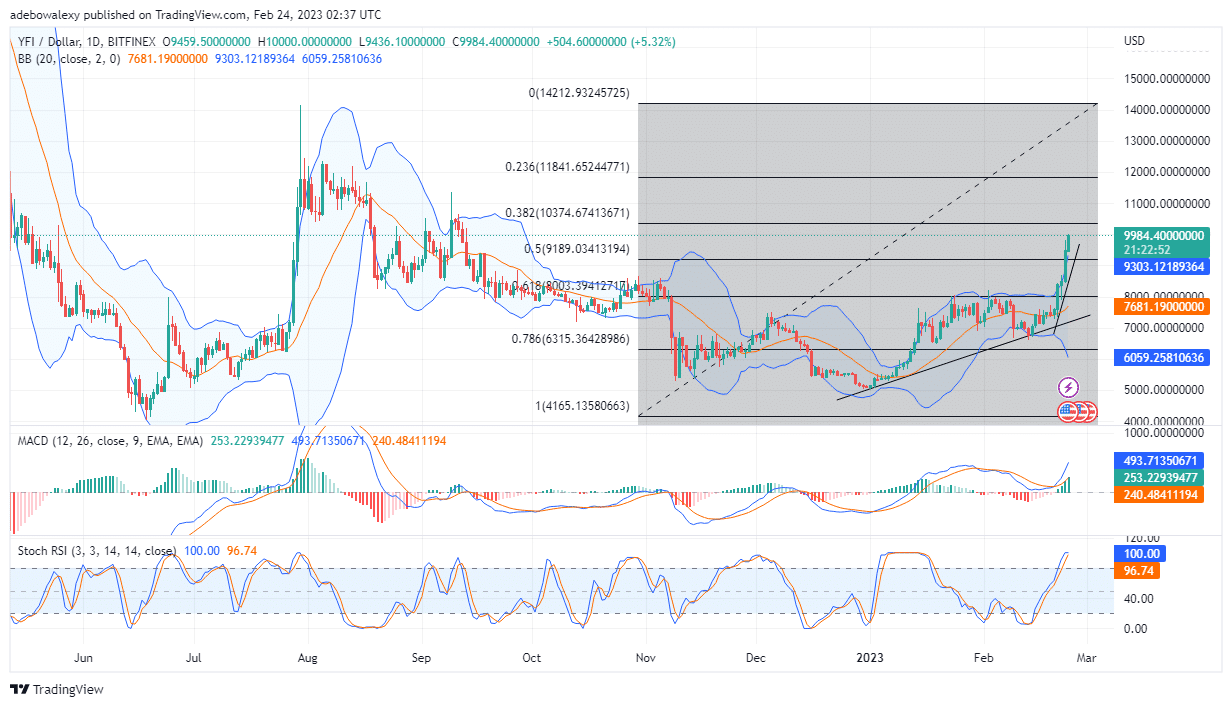
Price action in the Yearn.finance (YFI) daily market is just inches away from claiming the $10,000 price level. At this point, trading indicators continue to show encouraging indications that price action may even surpass the above-mentioned price level. The last price candle on this chart has extended the YFI/USD price above the Fibonacci Retracement level 50 and towards the $10,374 mark. Also, the MACD indicator lines are still reaching upward, with the leading line almost at level 500. Additionally, the histogram bars of this indicator are still appearing green and tall. As a result, this suggests that more price increase is possible in this market. Also, the applied Stochastic RSI indicator lines are still in the overbought region and maintain their upside momentum. Therefore, all signs still align with the opinion that the price may still rise in an upward direction.

Yearn.finance (YFI) Price Stays on Course Towards the $10,000 Mark
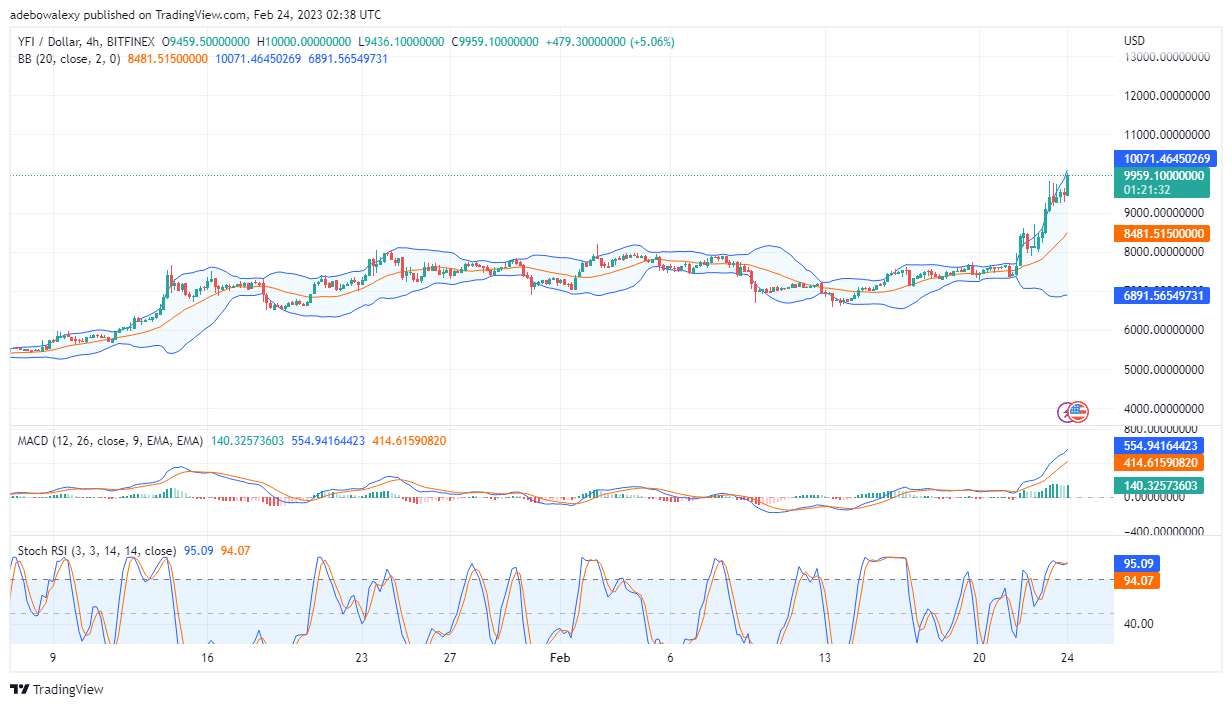
On the 4-hour Yearn.finance market, price activities stay largely on course towards the acquired target of the $10,000 price mark. The last price candle here remains bullish in appearance. However, there has been some length contraction, resulting in a price decrease from $9,984 to $9,959. The lines of the RSI appear a bit mangled above the 90 levels of the indicator, but still appear to be aiming to climb higher. Also, the MACD indicator lines can still be seen reaching for the skies above the equilibrium level. Also, the histogram bars on the MACD indicator seem to have regained their vivid green appearance. As a result, this suggests that the upward forces may be strengthening. Therefore, traders and investors can expect to see the YFI price eventually claim the $10,374 mark.
- Broker
- Min Deposit
- Score
- Visit Broker
- Award-winning Cryptocurrency trading platform
- $100 minimum deposit,
- FCA & Cysec regulated
- 20% welcome bonus of upto $10,000
- Minimum deposit $100
- Verify your account before the bonus is credited
- Fund Moneta Markets account with a minimum of $250
- Opt in using the form to claim your 50% deposit bonus
Learn to Trade
Never Miss A Trade Again

Signal Notification
Real-time signal notifications whenever a signal is opened, closes or Updated

Get Alerts
Immediate alerts to your email and mobile phone.

Entry Price Levels
Entry price level for every signal Just choose one of our Top Brokers in the list above to get all this free.


