

XRP/USD Long-term Trend: Bearish
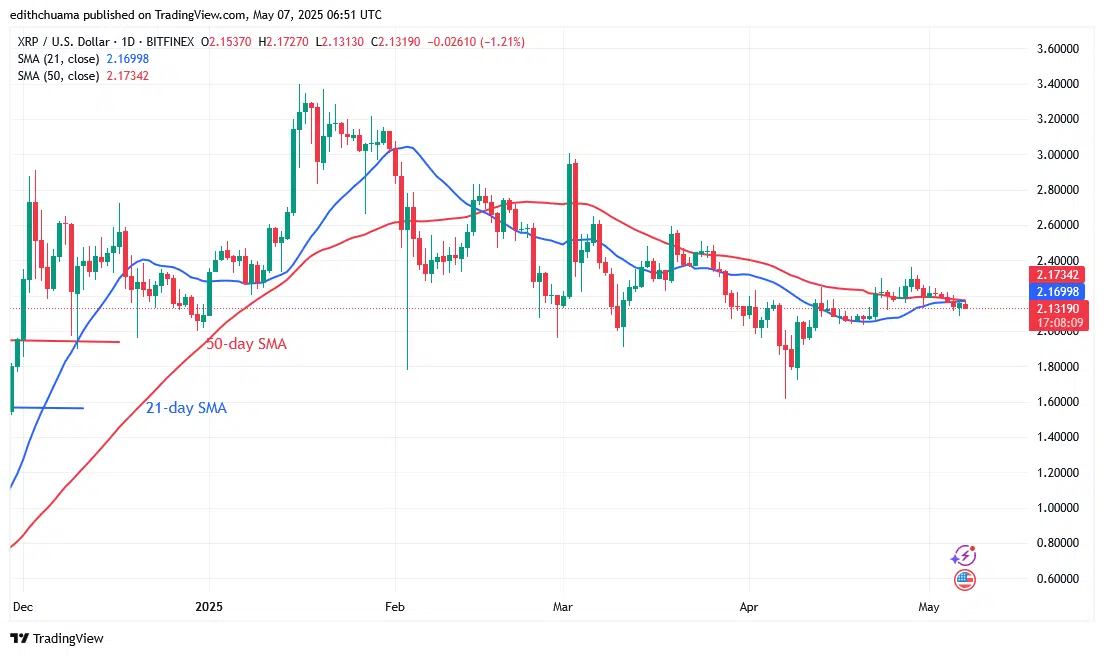
The price of XRP has remained stable between the $2.40 resistance and the $2.00 support. The price movement has been dominated by the Doji candlestick, which has stopped the market’s momentum. Since April 12, XRP has been consistently above the $2.00 support. XRP is steadily dropping toward $2.00. On the downside, if the bears breach the $2.00 support, the altcoin would drop back to its previous low of $1.61.
However, if the $2.00 support holds, the altcoin will continue its range-bound movement between the $2.00 and $3.00 price levels. Today, the decline has halted above the $2.13 support level.
Technical indicators
Key Resistance Levels: $2.50, $3.00, $3.50
Key Support Levels: $1.50, $1.00, $0.50
Daily Chart Indicators Reading:
The horizontal moving average lines are now above the price bars.XRP is steadily dropping due to the ongoing existence of Doji candlesticks. The altcoin has a tendency to fall since the price bars are below the moving average lines.
XRP/USD Medium-term Trend: Bearish
The price of XRP is declining on the 4-hour chart. The altcoin recently corrected higher, but it was pushed back at the 21-day SMA level. This suggests that the cryptocurrency will continue to decline. The altcoin is also trading within the bearish trend zone.

4-hour Chart Indicators Reading
The 21-day SMA is below the 50-day SMA, and the moving average lines are trending downward. This suggests a bearish crossover. The altcoin can keep losing ground. The price bars’ resistance line has been the 21-day SMA.
General Outlook for Ripple (XRP)
XRP is declining even if it is stuck in a range above the $2.00 support. Given that XRP has entered the bearish trend zone, a retest of the $2.00 critical support is likely. Second, XRP has encountered resistance from the 21-day SMA barrier. A bearish crypto signal is indicated when the altcoin falls below the moving average lines.
Make money without lifting your fingers: Start using a world-class auto trading solution.
Note: Learn2.Trade is not a financial advisor. Do your research before investing your funds in any financial asset or presented product or event. We are not responsible for your investing results.


