

XRP/USD Long-term Trend: Bearish
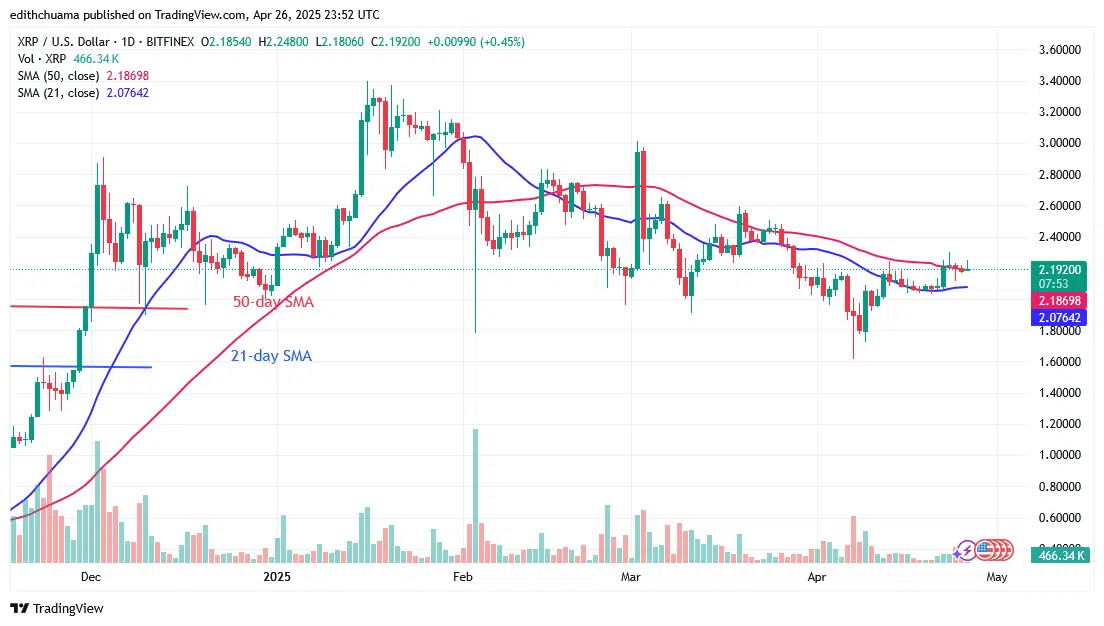
The price of XRP has been at a standstill above $2.00 since April 12. The upward trend has stopped close to the 50-day SMA. Buyers have not been able to hold the price above the 50-day SMA level, which bears are currently defending. However, if the price of XRP bounces back and crosses above the 50-day SMA, the altcoin will reach a high of $3.00.
However, if the bears breach the 21-day SMA support, the market would go below the prior low of $1.60. Near the 50-day SMA, the cryptocurrency is presently at a standstill. At the time of writing, XRP is worth $2.20.
Technical indicators
Key Resistance Levels: $2.50, $3.00, $3.50
Key Support Levels: $1.50, $1.00, $0.50
Daily Chart Indicators Reading:
The price bars are above the 21-day SMA but below the 50-day SMA. Buyers find it challenging to push the price above the 50-day SMA. The price bars separate the downward-sloping moving average lines. The Doji candlesticks are visible, and the price bars remain unaltered.
XRP/USD Medium-term Trend: Bearish
XRP prices are stabilizing above the $2.00 support. The price movement has remained stagnant because of the current Doji candlesticks. Buyers have always defended the $2.00 support. Today, XRP is hovering barely above the moving average lines.

4-hour Chart Indicators Reading
The 21-day SMA is above the 50-day SMA, and the moving average lines are sloping upward. Strong selling pressure is shown by the lengthy candlestick wicks aiming at the $2.20 peak. Right now, XRP is hovering just above the $2.00 support.
General Outlook for Ripple (XRP)
XRP’s attempt to rise on the daily chart has failed because the altcoin is above $2.00. XRP trades in a narrow range above the $2.00 support and the $2.30 resistance. Traders are still unsure of the crypto’s next course of action. The cryptocurrency indication is a sideways trend since traders are still uncertain.
Make money without lifting your fingers: Start using a world-class auto trading solution.
Note: Learn2.Trade is not a financial advisor. Do your research before investing your funds in any financial asset or presented product or event. We are not responsible for your investing results.


