

XRP/USD Long-term Trend: Bearish
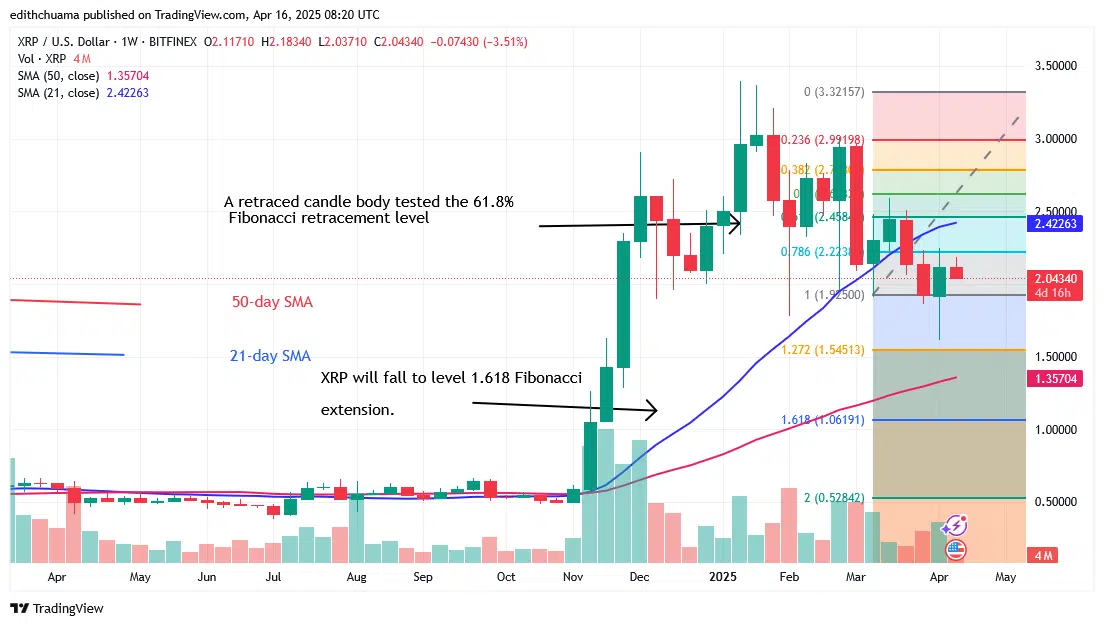
The price of XRP is still above the $2.00 key support even though it is dropping. The cryptocurrency asset has fluctuated below the 50-day SMA resistance and above the 21-day SMA support. In other words, XRP has been stuck between the $2.00 support and the $2.25 peak. Although XRP has fallen since April 13, bears are having trouble breaking through the 21-day SMA support.
XRP is probably going to continue to drop on the weekly chart. XRP will fall the 50-day SMA support if the bears breach the $2.00 critical support. In other words, XRP will reach the $1.06 low, or 1.618, Fibonacci extension level. XRP is now worth $2.06.
Technical indicators
Key Resistance Levels: $2.50, $3.00, $3.50
Key Support Levels: $1.50, $1.00, $0.50
Weekly Chart Indicators Reading:
The price bars on the weekly chart are stuck between the lines of the moving average. The bears are trying to move the cryptocurrency to the 50-day SMA support after breaking the 21-day SMA support. The cryptocurrency will continue to move in a range-bound fashion for a few days. The bears must first breach the $2.00 critical support in order to begin the fall.
XRP/USD Medium-term Trend: Bearish
Although XRP is declining on the daily chart, selling pressure has stopped above the 21-day SMA support. When the current support is breached, the drop will start. The presence of Doji candlesticks has caused the price movement to be sluggish.

Daily-hour Chart Indicators Reading
The price bars are between the moving average lines on the daily chart. Since April 13, the market’s direction has been the subject of a price war between bulls and bears. The 21-day SMA support is about to be broken by the Bears, who now hold the upper hand. On the other hand, a breakdown will force XRP to decline.
General Outlook for Ripple (XRP)
Since April 13, the price of XRP has been comparatively steady above the $2.00 key support. The existence of the Doji candlesticks has allowed XRP to decline gradually. When the range-bound levels are broken, XRP will trend. It is currently trading in a range. The crypto signal is bearish because the altcoin is being further rejected at the most recent high.
Make money without lifting your fingers: Start using a world-class auto trading solution.
Note: Learn2.Trade is not a financial advisor. Do your research before investing your funds in any financial asset or presented product or event. We are not responsible for your investing results.
- Broker
- Min Deposit
- Score
- Visit Broker

- Award-winning Cryptocurrency trading platform
- $100 minimum deposit,
- FCA & Cysec regulated

- 20% welcome bonus of upto $10,000
- Minimum deposit $100
- Verify your account before the bonus is credited


- Fund Moneta Markets account with a minimum of $250
- Opt in using the form to claim your 50% deposit bonus


