FTSE 100 Analysis – May 7
FTSE 100 shows a strong recovery, with bullish momentum beginning to emerge. The index is currently exhibiting bullish signals supported by key indicators. The 9-day Simple Moving Average (SMA) is trending upward at approximately $8,500, with the price trading slightly above it at around $8,580. This confirms short-term bullish momentum. The Moving Average Convergence Divergence (MACD) also reflects a bullish sentiment, as the MACD line remains well above the signal line with positive histogram bars continuing to grow. This indicates increasing upward pressure. These indicators collectively support the prevailing upward bias in market sentiment.
FTSE 100 Key Levels
Resistance Levels: $8,800, $9,000, $9,200
Support Levels: $8,480, $8,110, $7,540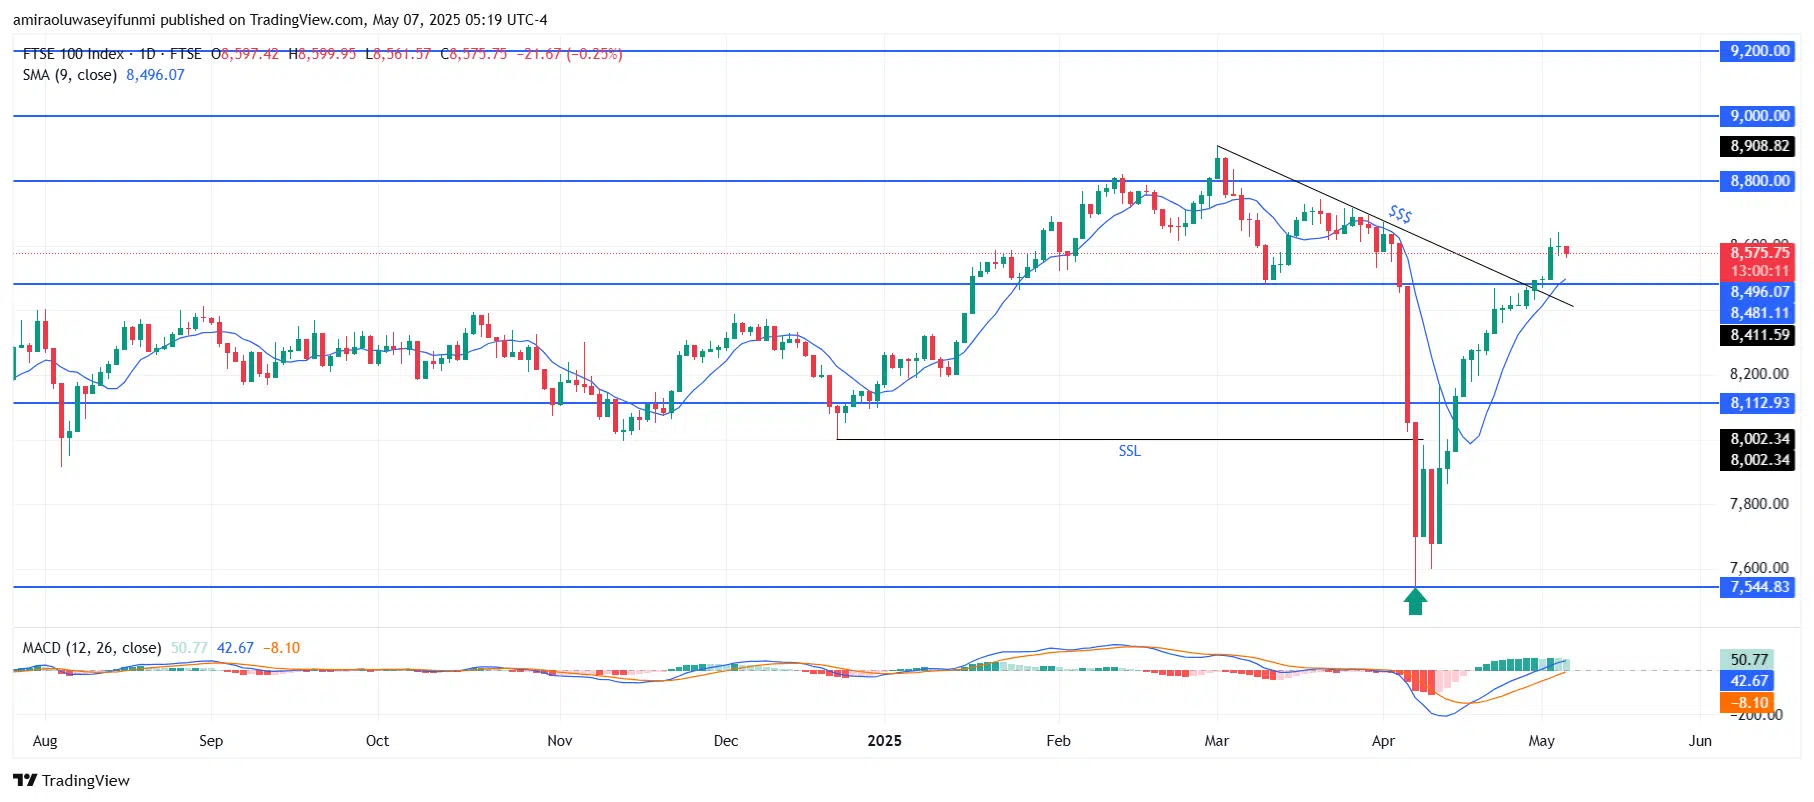
FTSE 100 Long-Term Trend: Bullish
The price action reinforces the bullish narrative, as the index rebounded sharply from $7,540, forming a bullish engulfing candle near that level. It broke above a descending trendline and reclaimed the $8,480 resistance, which now serves as support. This breakout and subsequent retest confirm a positive shift in market structure. The recent price consolidation above this level suggests accumulation and the development of a potential continuation pattern.
Looking ahead, if the index remains above the $8,480 zone, a bullish move toward $8,800 is likely, with $8,910 and $9,000 as further upside targets. A daily close above $8,800 would validate continued bullish momentum and set the stage for a retest of the $9,200 high. As long as the price holds above the $8,480 support area, the bullish outlook remains valid, and pullbacks could present buying opportunities.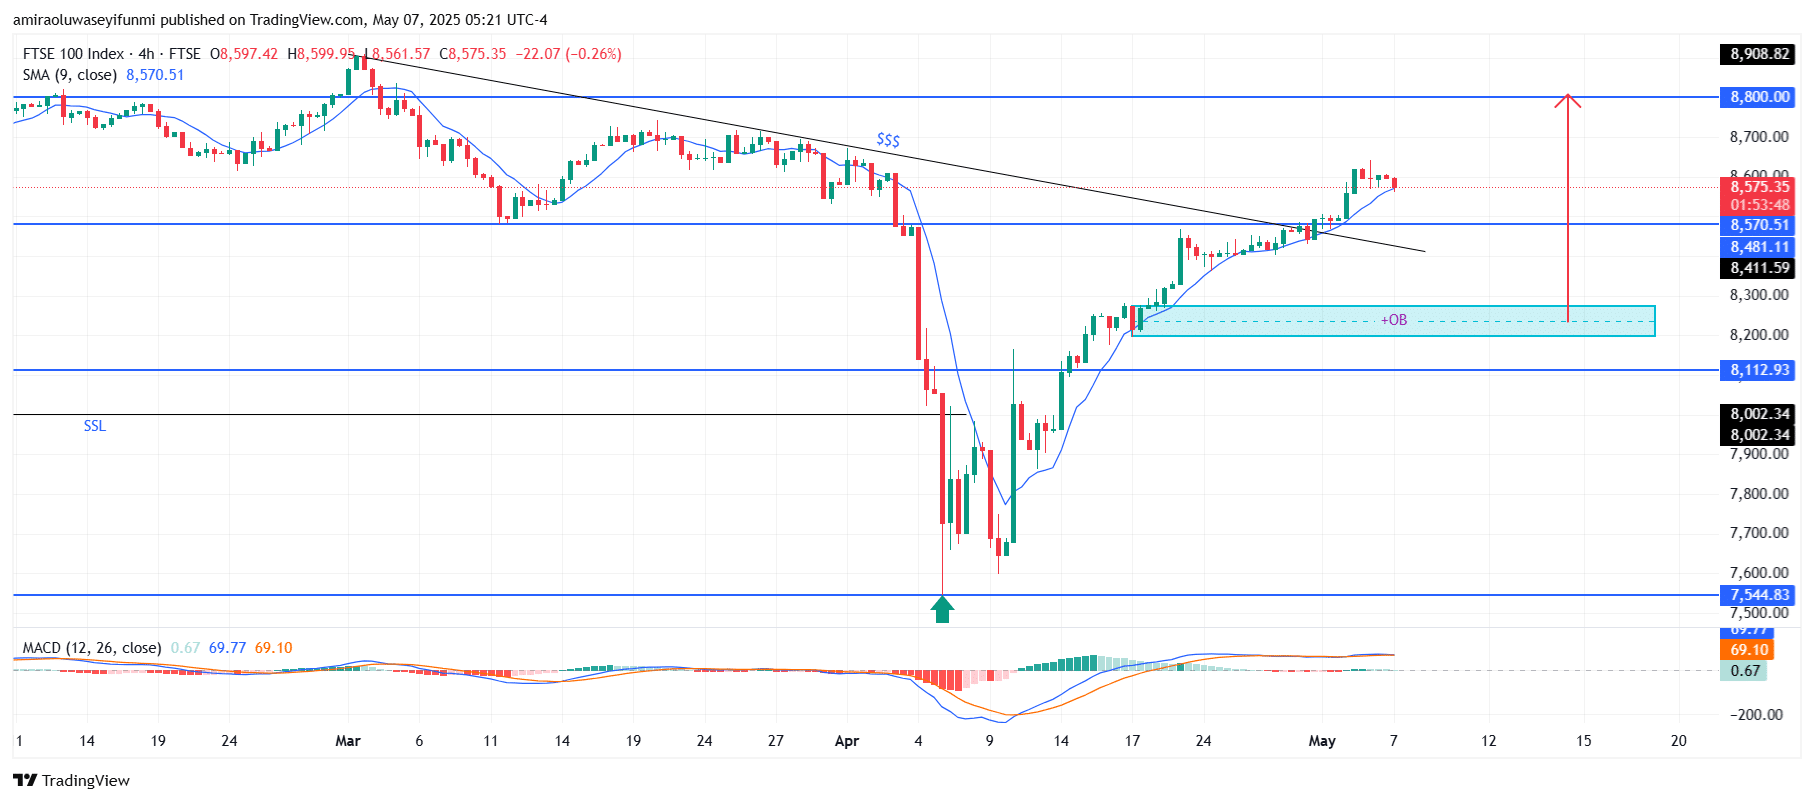
FTSE 100 Short-Term Trend: Bullish
The FTSE 100 shows strong bullishness on the four-hour chart, based on technical indicators. The price has successfully broken above the horizontal resistance at $8,480. Following the recent invalidation of the diagonal resistance, any retracement is expected to be short-lived around the $8,250 bullish order block. Traders watching forex signals may find confluence in this bullish setup, further supporting the potential for continued upward movement.
Make money without lifting your fingers: Start using a world-class auto trading solution
How To Buy Lucky Block – Guide, Tips & Insights | Learn 2 Trade
Note: Learn2.trade is not a financial advisor. Do your research before investing your funds in any financial asset, product, or event. We are not responsible for your investment results.
- Broker
- Min Deposit
- Score
- Visit Broker

- Award-winning Cryptocurrency trading platform
- $100 minimum deposit,
- FCA & Cysec regulated

- 20% welcome bonus of upto $10,000
- Minimum deposit $100
- Verify your account before the bonus is credited
- Fund Moneta Markets account with a minimum of $250
- Opt in using the form to claim your 50% deposit bonus
Learn to Trade
Never Miss A Trade Again

Signal Notification
Real-time signal notifications whenever a signal is opened, closes or Updated

Get Alerts
Immediate alerts to your email and mobile phone.

Entry Price Levels
Entry price level for every signal Just choose one of our Top Brokers in the list above to get all this free.