XRP/USD Long-term Trend: Ranging
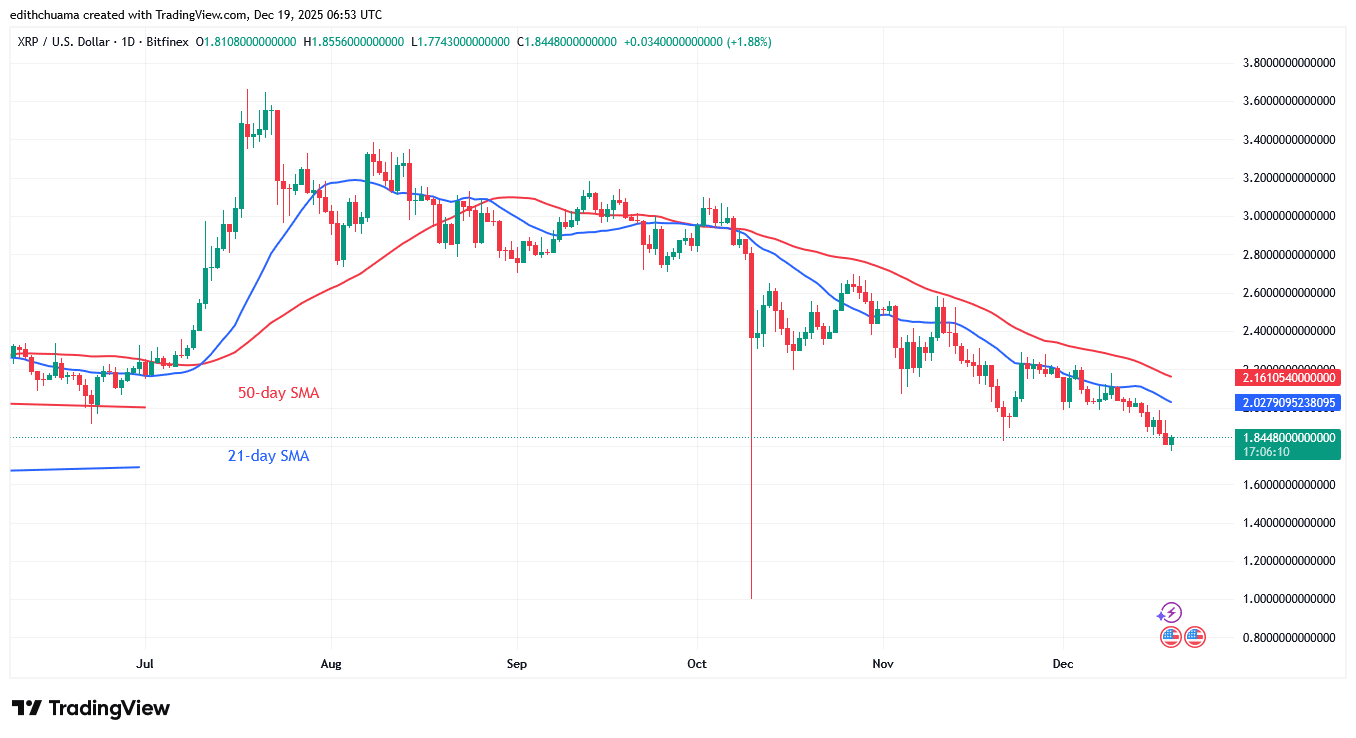
The price of XRP trades within its range as it dips below the $1.80 support. Since November 21, the XRP price has traded solidly above the $1.80 support level but below the 21-day SMA barrier. Since November 24, bears have surpassed bulls at the 21-day SMA level. The rejection of the 21-day SMA barrier prompted XRP to fall. The bearish momentum broke through the present support to hit a low of $1.77. The XRP price is rising as bulls buy on dips.
On the downside, if the $1.80 support holds, XRP will continue to trade below the 21-day SMA barrier. However, if the bears breach the $1.80 support level, XRP will resume selling pressure. The altcoin will return to its October 10 price level of $1.00. Today, XRP is now worth $1.86.
Technical indicators
Key Resistance Levels: $2.50, $3.00, $3.50
Key Support Levels: $1.50, $1.00, $0.50
Daily Chart Indicators Reading:
The 21-day and 50-day SMAs are progressively sliding downward. The 21-day SMA barrier has halted further upward movement in the cryptocurrency. The development of Doji candlesticks has restrained the price movement. The decline will halt if buyers keep the price above the moving average lines.
XRP/USD Medium-term Trend: Bearish
XRP’s price has fallen to a lower range while remaining in a sideways trend. Today, XRP fell to a low of $1.77 before recovering above its current support at $1.80. On the 4-hour chart, the cryptocurrency price is trading in a narrow range above the $1.80 support but below the moving average lines. However, selling pressure will continue if buyers fail to maintain their bullish momentum above the 21-day SMA barrier.

4- Chart Indicators Reading
The 21-day and 50-day SMAs have plummeted sharply into the negative trend zone. The 21-day SMA is below the 50-day SMA, indicating a fall. Long candlestick tails point above the $1.80 support, indicating significant buying pressure above that level.
General Outlook for Ripple (XRP)
The XRP price faces a fall as it dips below the $1.80 support. This is the second time that the $1.80 support will be tested. On November 21, the cryptocurrency price plummeted to the $1.80 support level, and bulls bought the dips. The XRP price rose above the moving average lines, then sold off near the $2.25 high. Today, XRP is trading below the 21-day SMA barrier.
Make money without lifting your fingers: Start using a world-class auto trading solution.
Note: Learn2.Trade is not a financial advisor. Do your research before investing your funds in any financial asset, product, or event. We are not responsible for your investment results.
- Broker
- Min Deposit
- Score
- Visit Broker

- Award-winning Cryptocurrency trading platform
- $100 minimum deposit,
- FCA & Cysec regulated

- 20% welcome bonus of upto $10,000
- Minimum deposit $100
- Verify your account before the bonus is credited
- Fund Moneta Markets account with a minimum of $250
- Opt in using the form to claim your 50% deposit bonus
Learn to Trade
Never Miss A Trade Again

Signal Notification
Real-time signal notifications whenever a signal is opened, closes or Updated

Get Alerts
Immediate alerts to your email and mobile phone.

Entry Price Levels
Entry price level for every signal Just choose one of our Top Brokers in the list above to get all this free.