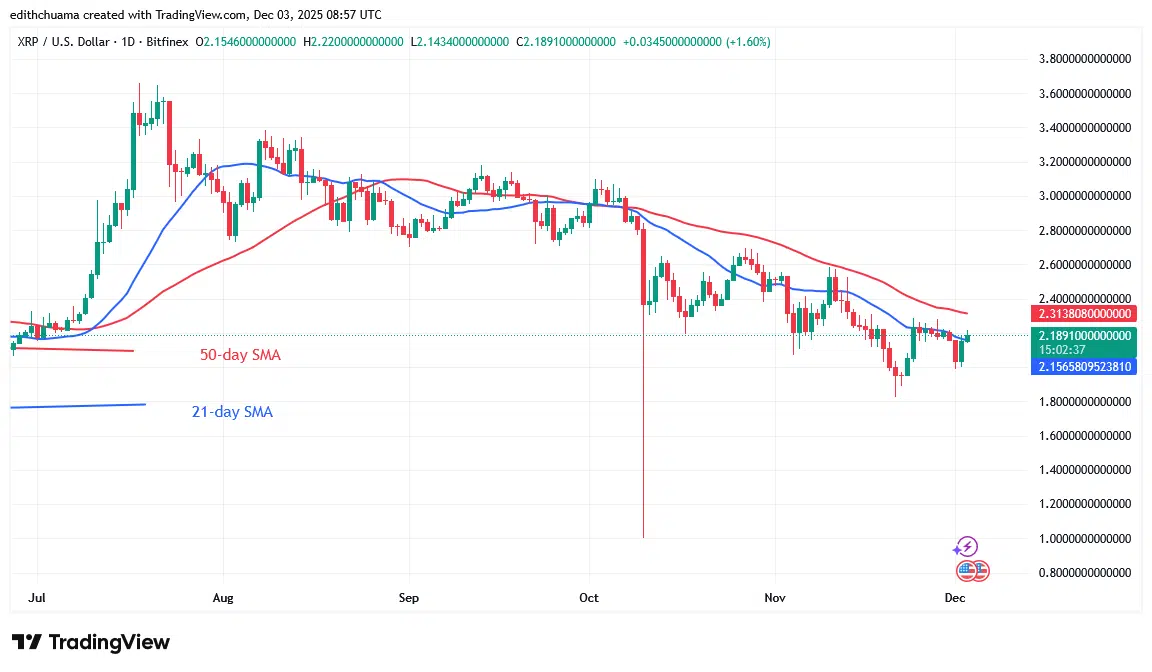
XRP/USD Long-term Trend: Bearish
The XRP price remains above the $2.00 low as bulls and bears compete for price possession at the 21-day SMA level. On December 1, the bears broke below the resistance, bringing the price to a low of $1.98. Today, bulls bought dips and rose above the moving average lines. On the upside, XRP will rise if the cryptocurrency price remains above the 21-day SMA support. XRP will reach a high of $2.40, or the 50-day SMA barrier.
However, XRP will continue to fall if the cryptocurrency price falls below the 21-day SMA threshold. XRP will drop to a low of $1.82. Today, the upward trend has hit a peak of $2.18.
Technical indicators
Key Resistance Levels: $2.50, $3.00, $3.50
Key Support Levels: $1.50, $1.00, $0.50
Daily Chart Indicators Reading:
The moving average lines are in a downward slope while the price bars are below it. Presently, the bulls and bears are battling at the 21-day SMA barrier to take possession of the price. The price bars are characterized by Doji candlesticks, which cause the altcoin to be range-bound. The price movement has remained stationary because of the creation of Doji candlesticks.
XRP/USD Medium-term Trend: Ranging
The XRP price has stalled its decline above $1.85, indicating a sideways trend. Since November 21, the altcoin has been trading above the $1.85 support and below the $2.30 high. The price has held steady above the moving average lines, but it confronts rejection at the recent high.
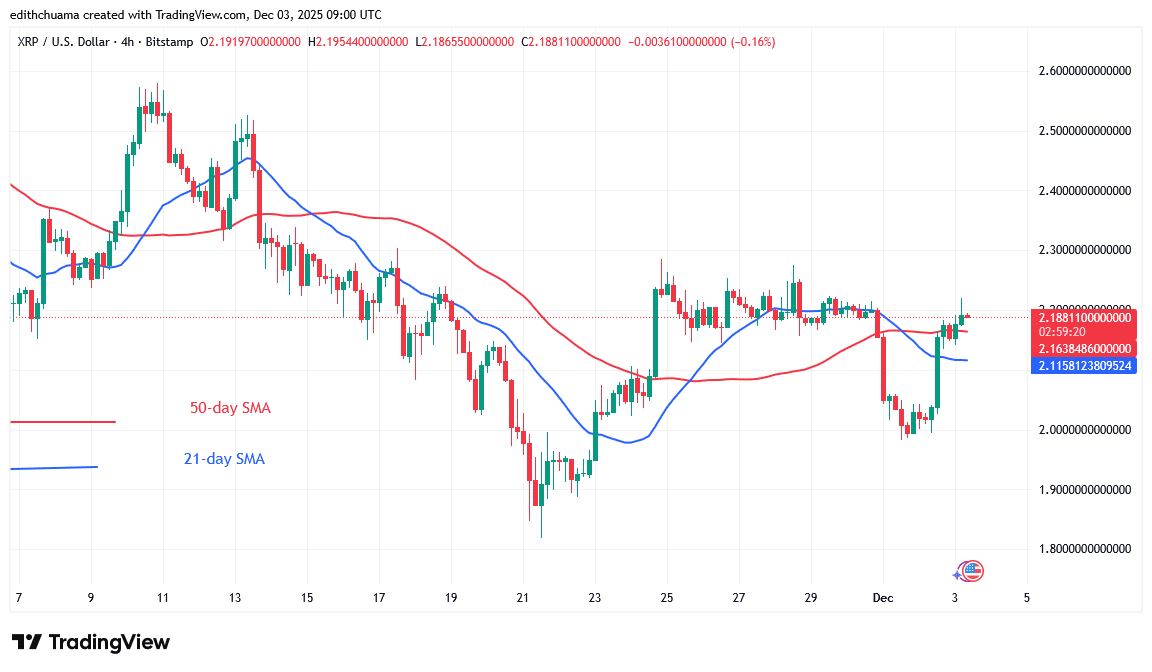
4- Chart Indicators Reading
On the 4-hour chart, the 21-day and 50-day SMAs are horizontal, indicating a sideways trend. The price bars have remained above the moving average lines and are currently consolidating above them. The 21-day SMA is lower than the 50-day SMA, suggesting the preceding fall.
General Outlook for Ripple (XRP)
The XRP price fluctuates both below and above the 21-day SMA barrier as it stays above the $2.00 low. The cryptocurrency price is consolidating above the $2.00 support level after forming Doji candlesticks. Traders are unsure of the market’s direction. The existence of Doji candlesticks limits the crypto signal’s range.
Make money without lifting your fingers: Start using a world-class auto trading solution.
Note: Learn2.Trade is not a financial advisor. Do your research before investing your funds in any financial asset, product, or event. We are not responsible for your investment results.
- Broker
- Min Deposit
- Score
- Visit Broker

- Award-winning Cryptocurrency trading platform
- $100 minimum deposit,
- FCA & Cysec regulated

- 20% welcome bonus of upto $10,000
- Minimum deposit $100
- Verify your account before the bonus is credited
- Fund Moneta Markets account with a minimum of $250
- Opt in using the form to claim your 50% deposit bonus
Learn to Trade
Never Miss A Trade Again

Signal Notification
Real-time signal notifications whenever a signal is opened, closes or Updated

Get Alerts
Immediate alerts to your email and mobile phone.

Entry Price Levels
Entry price level for every signal Just choose one of our Top Brokers in the list above to get all this free.