EUR/JPY Significant Levels
Resistance Levels: 185.00, 187.00, and 189.00
Support Levels: 184.00, 182.00, and 175.00
EUR/JPY Long-term Trend: Bullish
The EUR/JPY market gained notable bullish momentum in today’s trading. This followed the Bank of Japan’s interest rate announcement, which had a negative effect on the JPY, causing the EUR/JPY market to spike. This move occurred as the euro maintained a relatively stable bullish path, even though its consumer confidence data came in lower than anticipated. Meanwhile, the yen’s interest rate was announced at 0.75%, as expected; however, the pair still picked up bullish momentum following the decision.
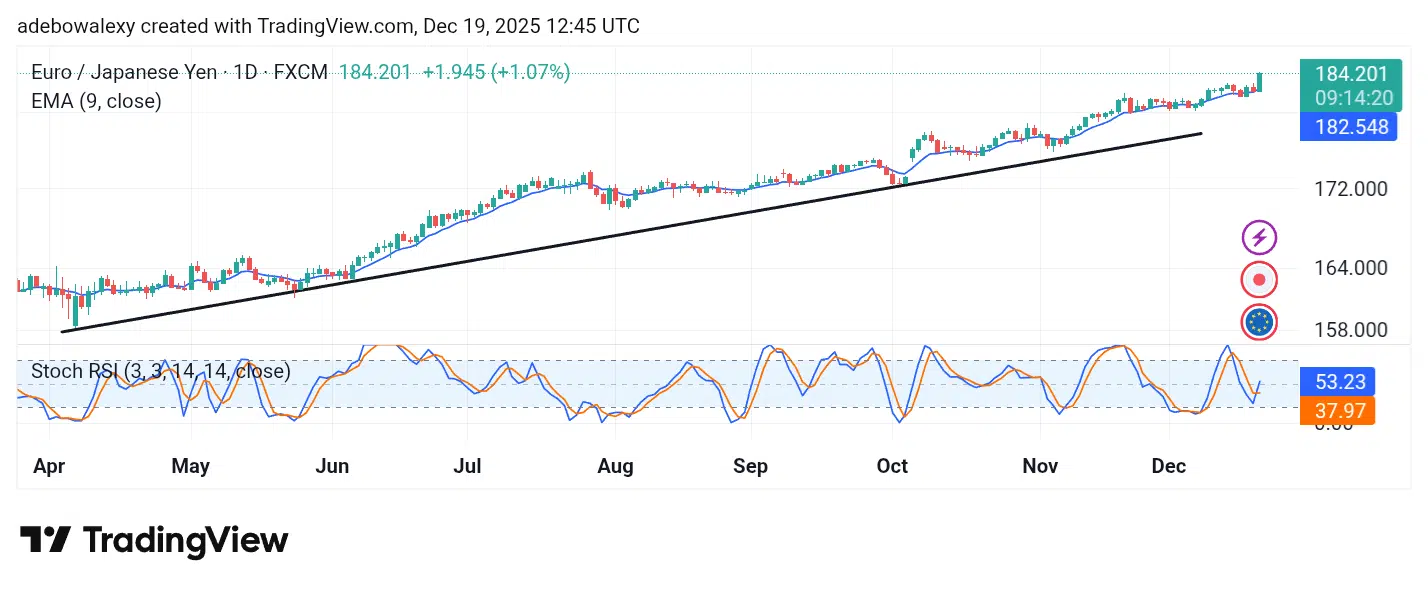
Daily Chart Indicators Reading
Today’s trading has been particularly bullish, judging by recent price action. Meanwhile, the Stochastic Relative Strength Index (SRSI) indicator lines have just delivered an upside crossover just below the 20 threshold level. Additionally, the lead line has turned sharply upward.
The most recent price candle is a long green one, and it stands above the 9-day Exponential Moving Average (EMA) line. The close of this candle shows the pair trading above the 184.00 price level, which hints that the market will likely close higher than it opened.
EUR/JPY Medium-term Trend: Bullish
On the 4-hour price chart, the EUR/JPY market reveals that upside forces appear slightly strained. This is so even though price action is positioned at a significant distance above the 9-day EMA line. The most recent price candle has a noticeable upper shadow, indicating that downward forces acted during the session, forcing a modest bearish retracement. Nevertheless, bulls managed to retain some of their gains, as the price candle took the form of an inverted hammer.

4-hour Chart Indicators Reading
Considering the indicator readings, there are signs of a potential bearish pullback. The SRSI indicator lines have moved into the overbought zone.
The lead line has risen deep into the overbought region, approaching the 90 threshold level. Meanwhile, the 9-day EMA curve remains below the most recent price candle. In fact, the last candle stands at a notable distance above the 9-day EMA curve.
General Outlook for EUR/JPY
The combination of technical and fundamental indicators suggests that the EUR/JPY market may continue edging higher in subsequent sessions. This outlook is supported by the fact that the most recent daily price candle stands above the 9-day EMA curve. Similarly, on the medium-term chart, the last price candle remains above this technical benchmark.
The key difference between the daily and the 4-hour charts is the hint of a possible short-term pullback. However, given that the price candle is positioned at a considerable distance above the 9-day EMA, any pullback is unlikely to threaten the longer-term bullish move toward the 185.00 and 187.00 price levels.
Make money without lifting your fingers: Start trading smarter today
- Broker
- Min Deposit
- Score
- Visit Broker

- Award-winning Cryptocurrency trading platform
- $100 minimum deposit,
- FCA & Cysec regulated

- 20% welcome bonus of upto $10,000
- Minimum deposit $100
- Verify your account before the bonus is credited
- Fund Moneta Markets account with a minimum of $250
- Opt in using the form to claim your 50% deposit bonus
Learn to Trade
Never Miss A Trade Again

Signal Notification
Real-time signal notifications whenever a signal is opened, closes or Updated

Get Alerts
Immediate alerts to your email and mobile phone.

Entry Price Levels
Entry price level for every signal Just choose one of our Top Brokers in the list above to get all this free.