XRP/USD Long-term Trend: Bearish
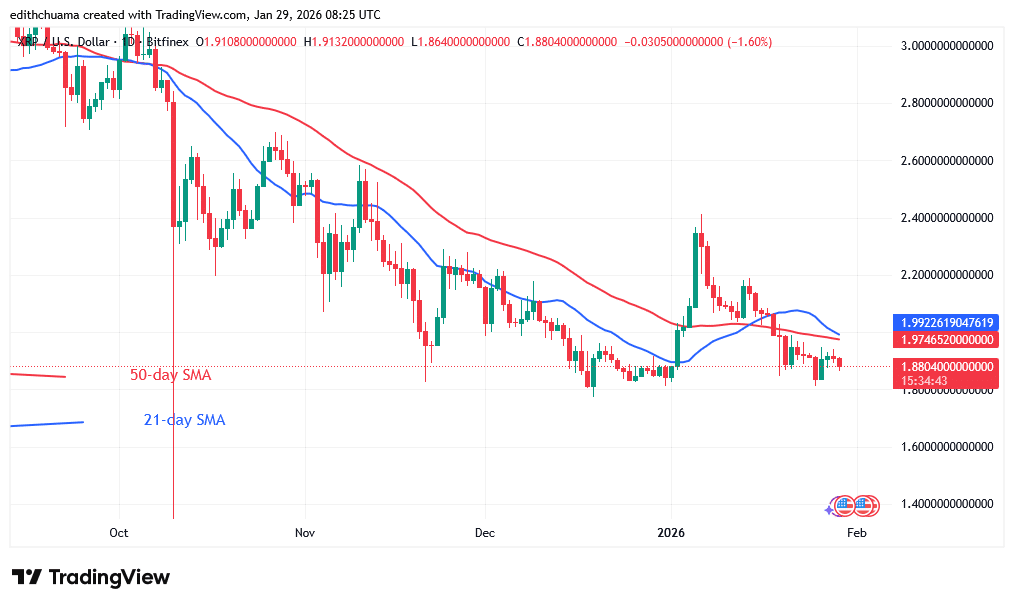
The XRP price upward correction has been repelled as it revisited its $1.80 bottom price. Since January 25, the altcoin has traded above the $1.80 support but below the moving average lines. The upward correction has been repelled at $1.94, and the cryptocurrency price has remained above the support level. XRP remains range-bound, above the $1.80 support but below the 50-day SMA. On the downside, XRP has dropped to the critical support level of $1.80.
However, additional declines in the cryptocurrency are unlikely. Since November 21, 2025, the bulls have been defending the $1.80 support. On the upside, XRP will resume its bullish trend if buyers maintain the price above the moving average lines. Meanwhile, as the Doji candlestick appears, XRP will continue to trade in a range. XRP is now worth $1.90.
Technical indicators
Key Resistance Levels: $2.50, $3.00, $3.50
Key Support Levels: $1.50, $1.00, $0.50
Daily Chart Indicators Reading:
The moving average lines are horizontal, and the 21-day SMA is above the 50-day SMA support. The price bars are below the moving average lines, but above their key support. Doji candlesticks denote the price bars, causing the altcoin to trade in a range.
XRP/USD Medium-term Trend: Ranging
XRP is trading flat after hitting a low of $1.80. On the 4-hour chart, the altcoin is trading in a narrow range above the $1.80 support and below the moving average lines, or the $1.95 resistance. The resistance at $1.95 has resisted the upward move twice. The price has continued its downward move since its decline below the moving average lines.

4- Chart Indicators Reading
On the 4-hour chart, the price bars are below the downward-sloping moving average lines, approaching the critical support level of $1.80. Prior to the fall, the price bars fluctuated between the 21-day SMA threshold.
General Outlook for Ripple (XRP)
The XRP price has been fluctuating above its $1.80 bottom price and below the moving average lines, or the resistance at $1.95. Today, the price fall has hit the critical support level of $1.80. The bulls have been defending the $1.80 support level since February 2025. It is unlikely that the bears would extend their bearish momentum past the $1.80 support.
Make money without lifting your fingers: Start using a world-class auto trading solution.
Note: Learn2.Trade is not a financial advisor. Do your research before investing your funds in any financial asset, product, or event. We are not responsible for your investment results.
- Broker
- Min Deposit
- Score
- Visit Broker

- Award-winning Cryptocurrency trading platform
- $100 minimum deposit,
- FCA & Cysec regulated

- 20% welcome bonus of upto $10,000
- Minimum deposit $100
- Verify your account before the bonus is credited
- Fund Moneta Markets account with a minimum of $250
- Opt in using the form to claim your 50% deposit bonus
Learn to Trade
Never Miss A Trade Again

Signal Notification
Real-time signal notifications whenever a signal is opened, closes or Updated

Get Alerts
Immediate alerts to your email and mobile phone.

Entry Price Levels
Entry price level for every signal Just choose one of our Top Brokers in the list above to get all this free.