XRP/USD Long-term Trend: Bearish
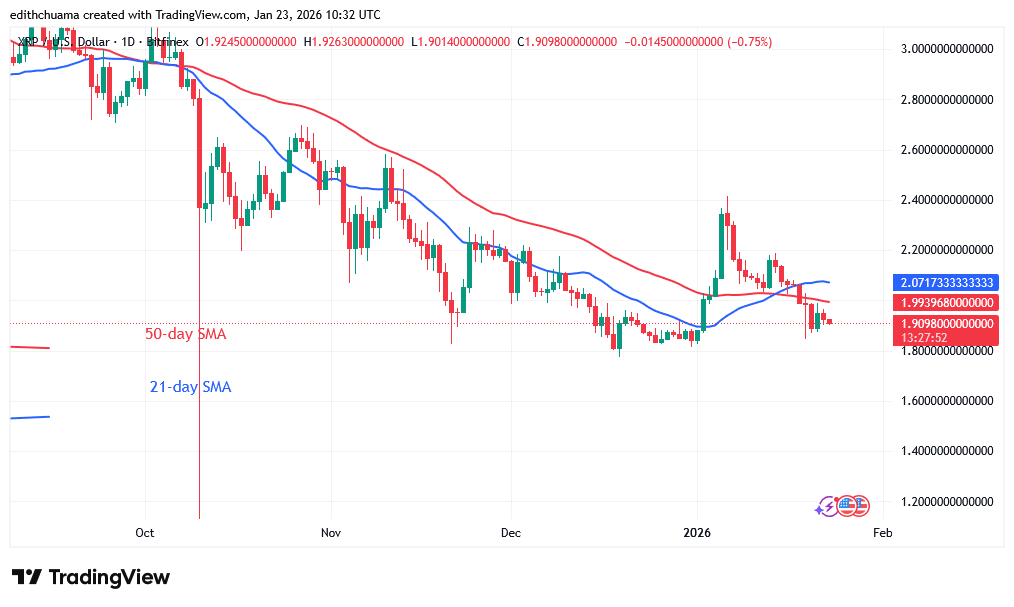
The XRP price is falling below the moving average lines but above its key support of $1.80. The cryptocurrency fell to a low of $1.84 before reversing. Since January 19, XRP has traded above the $1.80 support level but below the moving average lines. The bearish momentum has stalled above the $1.80 support. It is unlikely that selling pressure would resume below the $1.80 support.
The current support level of $1.80 has remained unbroken since November 21, 2025. Today, the cryptocurrency price fluctuates below the moving average lines. The cryptocurrency price will resume its upward trend if buyers keep it above the moving average lines.
Technical indicators
Key Resistance Levels: $2.50, $3.00, $3.50
Key Support Levels: $1.50, $1.00, $0.50
Daily Chart Indicators Reading:
The cryptocurrency price bars are located below the upward-sloping moving average lines. The 21-day SMA is above the 50-day SMA, indicating a past uptrend. The price falling below the moving average lines implies that the bullish trend has ended. On January 19, a long candlestick tail signals heavy buying pressure above the $1.80 support.
XRP/USD Medium-term Trend: Bearish
XRP is in a slump and has fallen past the expected price of $1.80. On January 19, the altcoin plummeted to a low of $1.85 before resuming a sideways trend above the $1.80 support but below the moving average lines. The 21-day SMA barrier has slowed upward advances. The price movement has remained stationary as Doji candlesticks appear.

4- Chart Indicators Reading
The price bars are below the downward-sloping moving average lines. The 21-day SMA falls below the 50-day SMA support. The 21-day SMA is preventing the cryptocurrency from continuing its upward trend. The development of Doji candlesticks has slowed the price movement.
General Outlook for Ripple (XRP)
The XRP price drops and recovers above its key support of $1.8. On the 4-hour chart, the cryptocurrency price is slightly higher than the $1.85 support level but lower than the 21-day SMA. The price trend has been stagnant, reaching a high of $1.90. Doji candlesticks appear, limiting the range of the crypto signal.
Make money without lifting your fingers: Start using a world-class auto trading solution.
Note: Learn2.Trade is not a financial advisor. Do your research before investing your funds in any financial asset, product, or event. We are not responsible for your investment results.
- Broker
- Min Deposit
- Score
- Visit Broker

- Award-winning Cryptocurrency trading platform
- $100 minimum deposit,
- FCA & Cysec regulated

- 20% welcome bonus of upto $10,000
- Minimum deposit $100
- Verify your account before the bonus is credited
- Fund Moneta Markets account with a minimum of $250
- Opt in using the form to claim your 50% deposit bonus
Learn to Trade
Never Miss A Trade Again

Signal Notification
Real-time signal notifications whenever a signal is opened, closes or Updated

Get Alerts
Immediate alerts to your email and mobile phone.

Entry Price Levels
Entry price level for every signal Just choose one of our Top Brokers in the list above to get all this free.