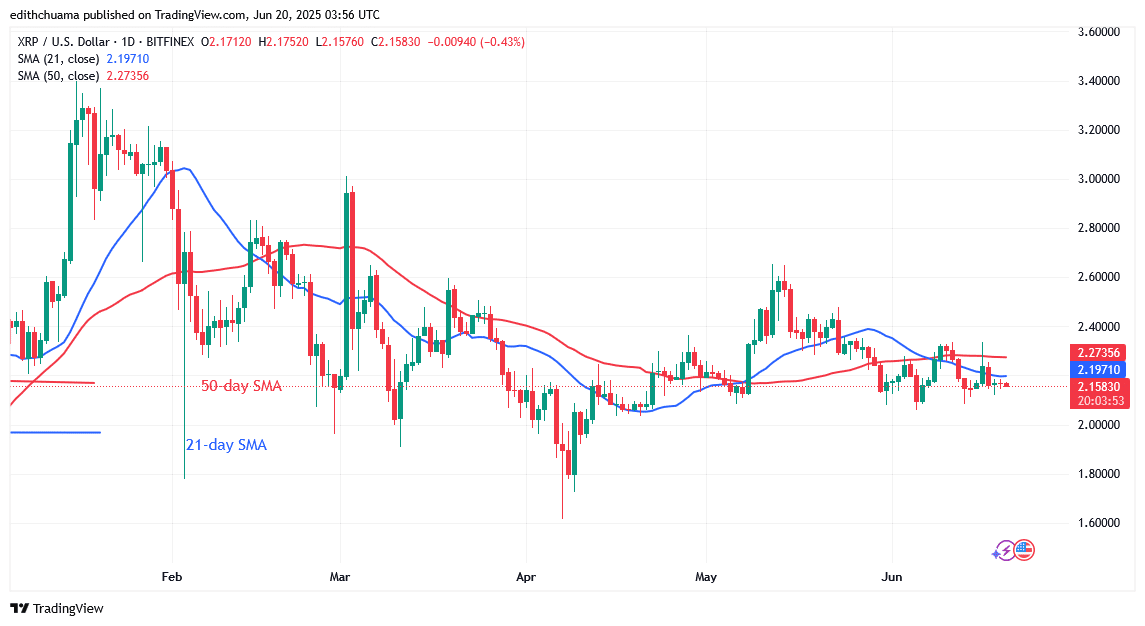
XRP/USD Long-term Trend: Bearish
XRP’s price oscillates between $2.00 and $2.35 barrier level. However, since May 30, the cryptocurrency asset has been trading in a small range between the moving average lines and the $2.00 support. The altcoin has consistently traded above the $2.00 support for more than two weeks. The moving average lines have held back the rising trend. A rise above moving average lines is doubtful.
However, the moving average lines have repulsed the bullish momentum three times. The 21-day SMA repulsed the positive momentum on June 17 as it fell and resumed consolidation above the $2.10 support. The altcoin is currently worth $2.17.
Technical indicators
Key Resistance Levels: $2.50, $3.00, $3.50
Key Support Levels: $1.50, $1.00, $0.50
Daily Chart Indicators Reading:
XRP is trading in the area of the bearish trend. The price bars display long candlestick tails that are below the moving average lines and headed toward the current price of $2.00. The extended candlestick tail indicates strong buying pressure above the $2.00 support. The trend is sideways, as shown by the horizontal moving average lines.
XRP/USD Medium-term Trend: Bearish
XRP is moving sideways between the $2.10 support and the $2.35 resistance on the 4-hour chart. The price of the cryptocurrency is currently trading in a confined range between the $2.14 support and below the moving average lines. The price movement has been locked below the moving average lines. If XRP recovers and breaks above the moving average lines, it will rise to the high of $2.34.
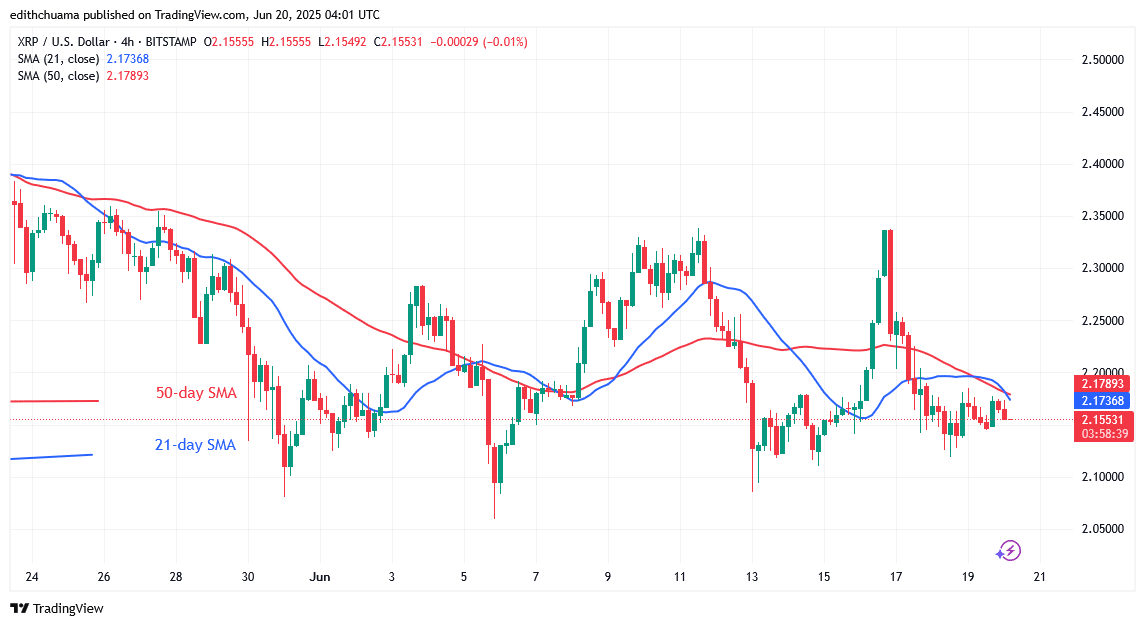
4-hour Chart Indicators Reading
The price bars have been below the horizontal moving average lines since June 17. The price bars have remained stationary due to the presence of Doji candlesticks. The sideways move is shown by the 21-day SMA sloping both below and above the 50-day SMA.
General Outlook for Ripple (XRP)
The price of XRP oscillates between $2.00 and $2.35 since traders are unsure of the market’s path. If it stays above the present support and doesn’t rise above the moving average lines, XRP will maintain its range. The altcoin will continue to trend as long as buyers keep the price above the moving average lines.
Make money without lifting your fingers: Start using a world-class auto trading solution.
Note: Learn2.Trade is not a financial advisor. Do your research before investing your funds in any financial asset, product, or event. We are not responsible for your investment results.
- Broker
- Min Deposit
- Score
- Visit Broker

- Award-winning Cryptocurrency trading platform
- $100 minimum deposit,
- FCA & Cysec regulated

- 20% welcome bonus of upto $10,000
- Minimum deposit $100
- Verify your account before the bonus is credited
- Fund Moneta Markets account with a minimum of $250
- Opt in using the form to claim your 50% deposit bonus
Learn to Trade
Never Miss A Trade Again

Signal Notification
Real-time signal notifications whenever a signal is opened, closes or Updated

Get Alerts
Immediate alerts to your email and mobile phone.

Entry Price Levels
Entry price level for every signal Just choose one of our Top Brokers in the list above to get all this free.