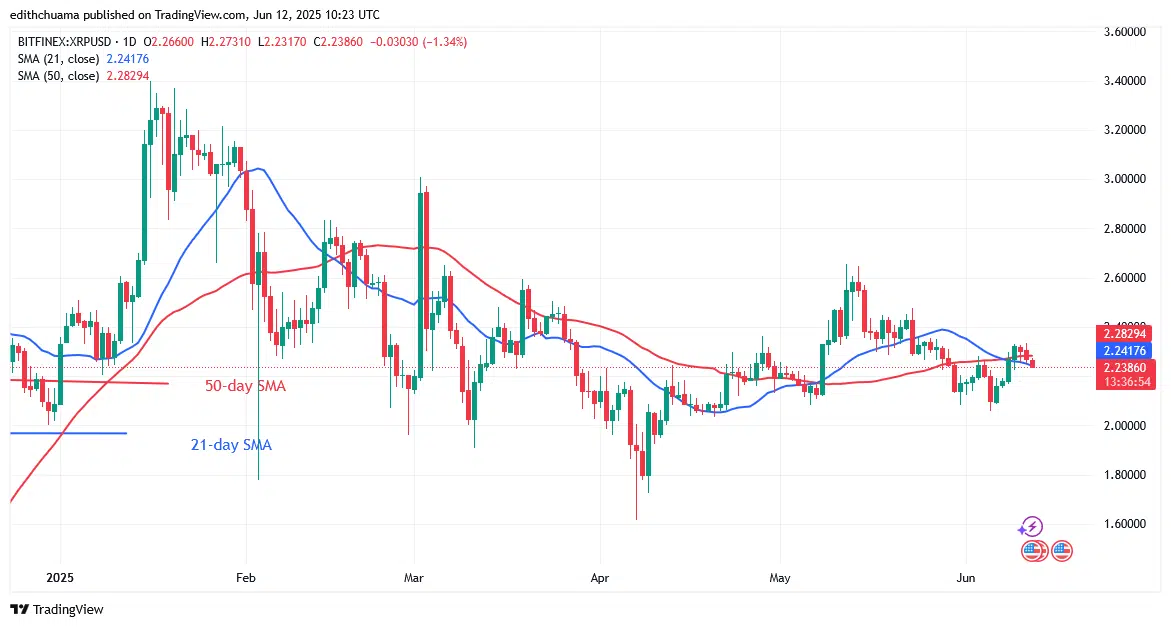
XRP/USD Long-term Trend: Bearish
The price of XRP rises above the moving average lines but slumps below the $2.33 mark. Although buyers were unable to keep the price above the moving average lines, the cryptocurrency asset reached a high of $2.33. The altcoin broke through the barrier at $2.33 and is now falling below the moving average lines. Since May 30, XRP has not been able to hit the $2.65 peak.
The altcoin will drop to its previous low of $2.00 if it breaks below the moving average lines. Buyers have equally defended the $2.00 support since April 17. The altcoin will maintain its range-bound move below the moving average lines or the resistance at $2.40. It is comparatively stable above the $2.00 support.
Technical indicators
Key Resistance Levels: $2.50, $3.00, $3.50
Key Support Levels: $1.50, $1.00, $0.50
Daily Chart Indicators Reading:
On June 9, after the fall, the price bars first crossed above the moving average lines. The price of XRP is currently falling back below the moving average lines following the rejection at the $2.33 barrier. The altcoin’s horizontal move above its critical support is about to continue.
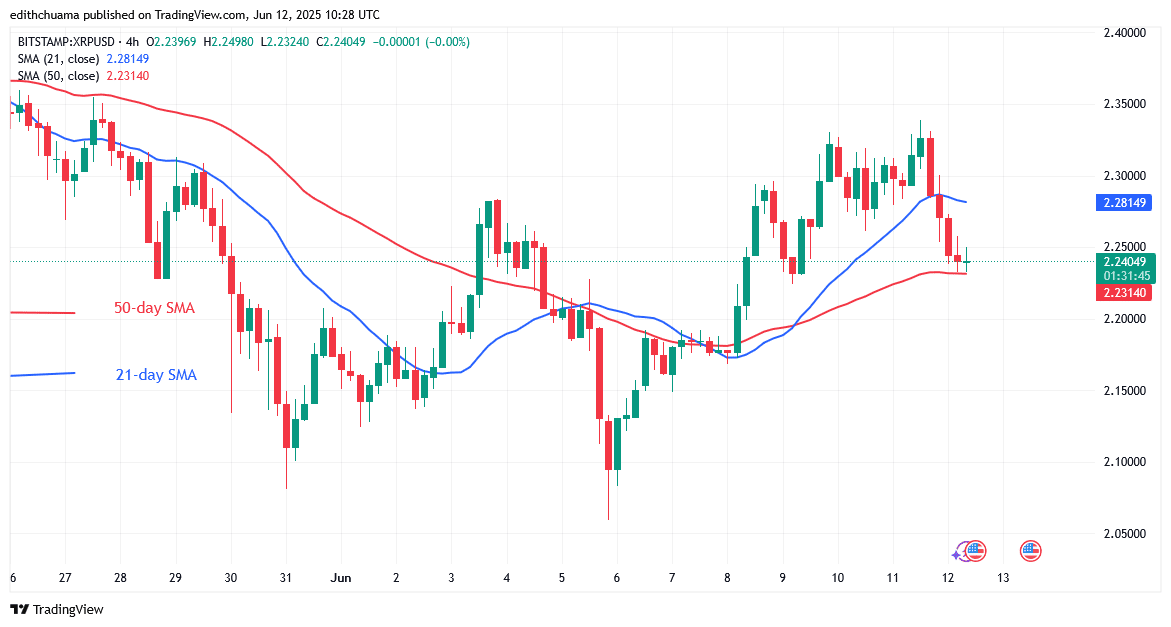
XRP/USD Medium-term Trend: Bearish
XRP’s price has fallen between the lines of the moving average. The bullish trend dropped below the moving average lines after hitting the $2.33 barrier twice. Beyond the 50-day SMA, the drop has paused. The price bars consolidating above the 50-day SMA suggests a possible upward surge.
4-hour Chart Indicators Reading
The price of XRP is stuck between the moving average lines based on the price behavior. If the 50-day SMA support is broken, XRP will fall. A break above the 21-day SMA signals an upward rise in the cryptocurrency. The price range will remain the same as long as these levels remain unbroken. The cryptocurrency is currently consolidating above the 50-day SMA.
General Outlook for Ripple (XRP)
XRP’s price stays steady above the $2.00 support but slumps below the $2.33 mark. Doji candlesticks have been used to denominate the price movement. XRP is range bound between the $2.00 support and below the resistance at the $2.35 high on the 4-hour chart.
Make money without lifting your fingers: Start using a world-class auto trading solution.
Note: Learn2.Trade is not a financial advisor. Do your research before investing your funds in any financial asset, product, or event. We are not responsible for your investment results.
- Broker
- Min Deposit
- Score
- Visit Broker

- Award-winning Cryptocurrency trading platform
- $100 minimum deposit,
- FCA & Cysec regulated

- 20% welcome bonus of upto $10,000
- Minimum deposit $100
- Verify your account before the bonus is credited
- Fund Moneta Markets account with a minimum of $250
- Opt in using the form to claim your 50% deposit bonus
Learn to Trade
Never Miss A Trade Again

Signal Notification
Real-time signal notifications whenever a signal is opened, closes or Updated

Get Alerts
Immediate alerts to your email and mobile phone.

Entry Price Levels
Entry price level for every signal Just choose one of our Top Brokers in the list above to get all this free.