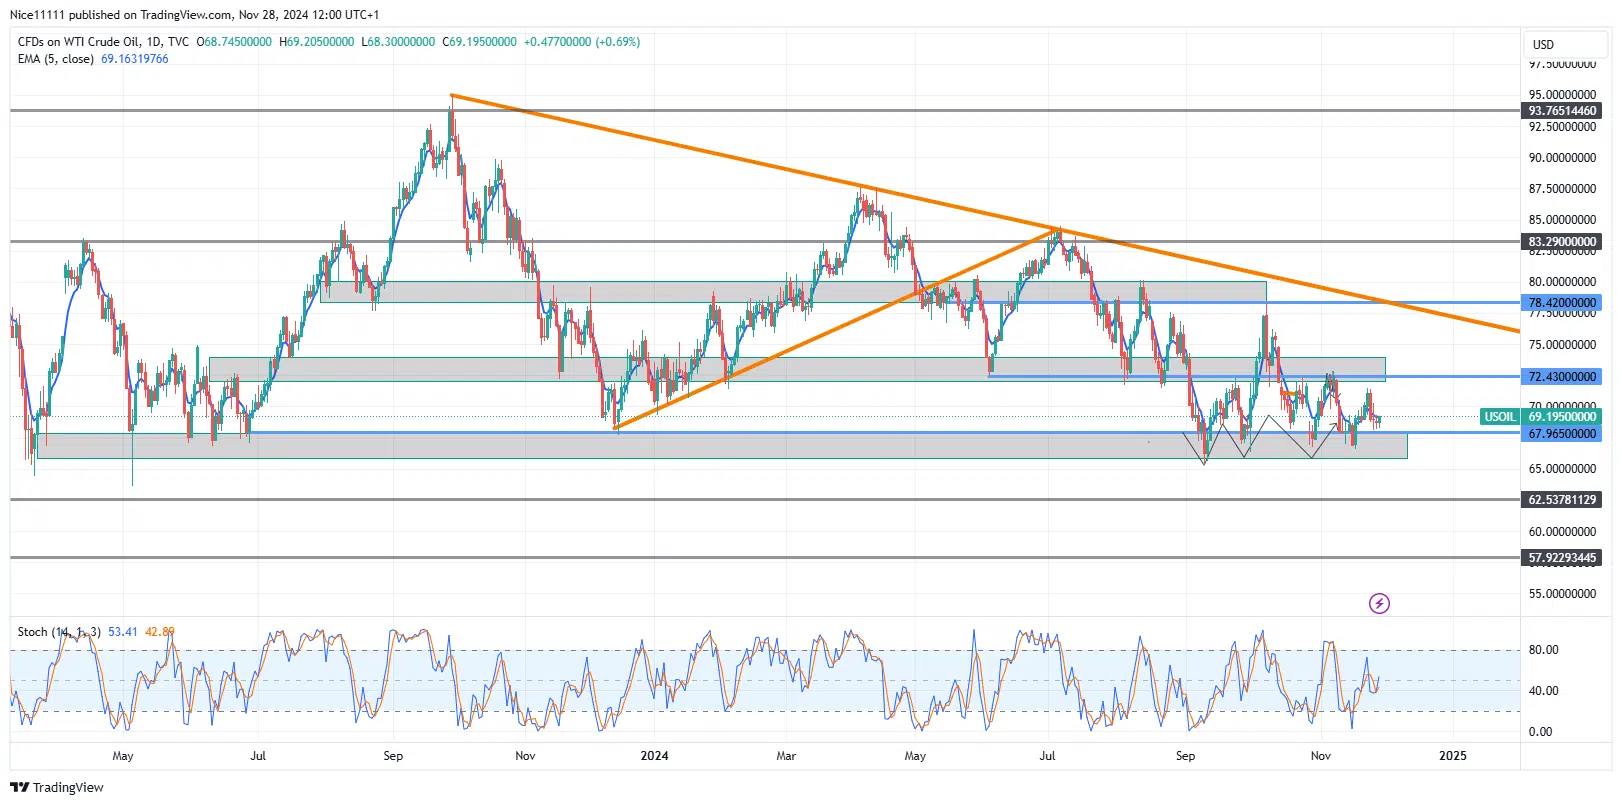
USOil has been consolidating within a range defined by the 72.430 resistance zone and the 67.970 support zone since early September. Price movements have consistently oscillated between these levels, forming a well-established range. Currently, the price failed to reach the resistance zone and has instead reversed downward, edging closer to the support level.
The ongoing consolidation favors range traders over swing traders. The Stochastic indicator aligns with this strategy, signaling buy opportunities when the price approaches oversold conditions at support and sell opportunities when it reaches overbought conditions near resistance.
For conservative traders, partial profit-taking or exiting at the midpoint of the range is a prudent strategy, rather than targeting the opposite end.
The Exponential Moving Average (EMA, period 9) acts as a dynamic guide for identifying directional changes. When the price moves below the EMA at key levels, it confirms bearish momentum. USOil is currently trading below the EMA without retesting the resistance zone, further indicating weakening momentum.
USOil Short-Term Trend: Bearish
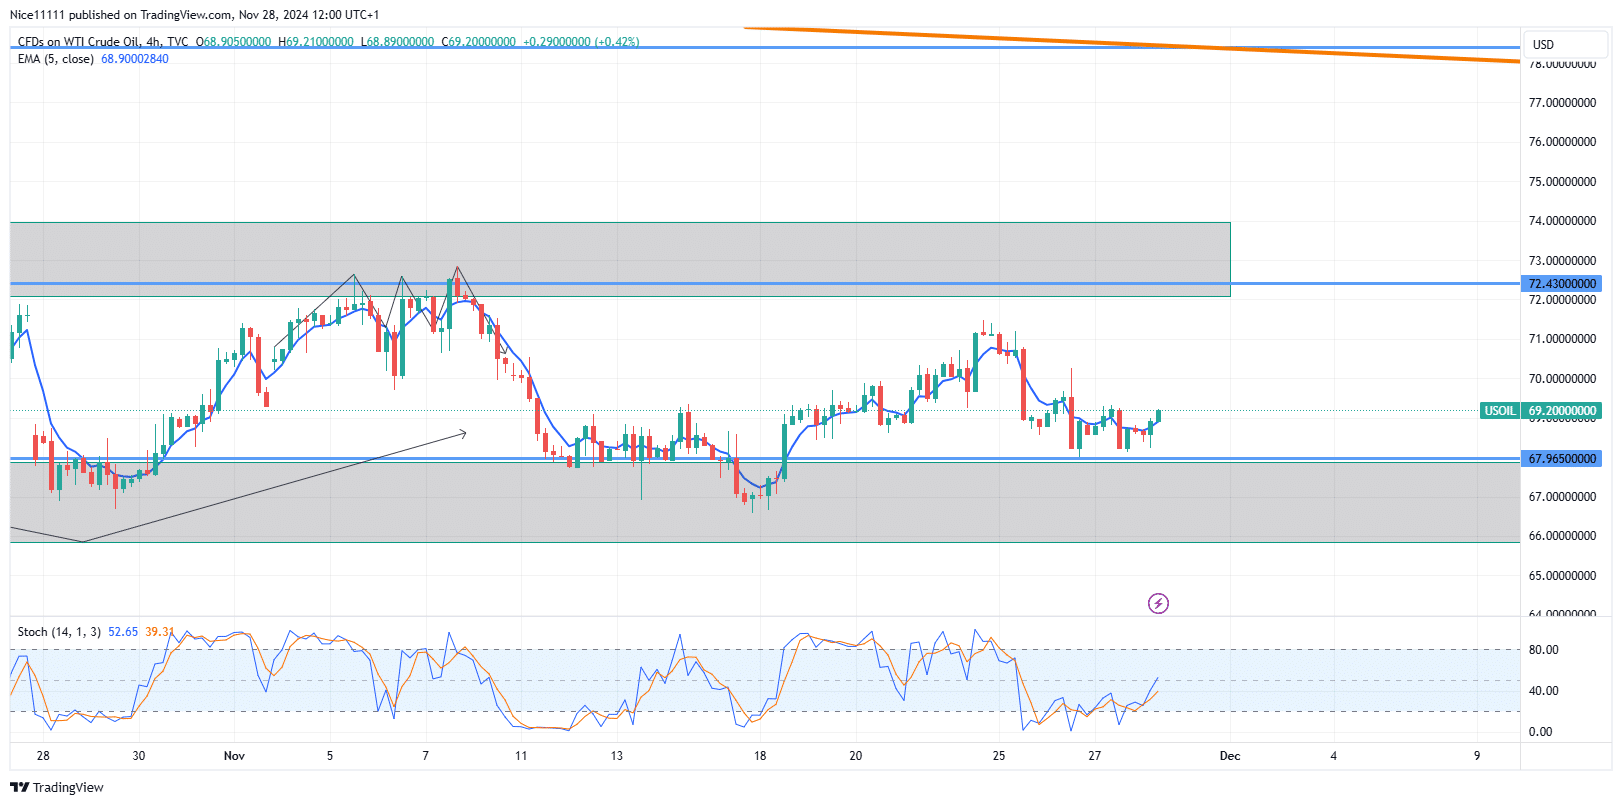
On the 4-hour timeframe, there have been no structural shifts signaling a breakout from the range. However, closely monitoring key levels on this lower timeframe can provide early confirmation of a directional change.
If the range continues to hold, the price is expected to rebound from the support level and target the 72.430 resistance zone. For traders using forex signals and technical indicators like the Stochastic and EMA, vigilant observation of these key levels is essential for making informed decisions.
Note: Learn2.trade is not a financial advisor. Do your research before investing your funds in any financial asset, product, or event. We are not responsible for your investment results.
Trade on MT4 with Leverage up to 1:500! Trade on MT4 with Leverage up to 1:500!
X
We use cookies to ensure that we give you the best experience on our website. If you continue to use this site we will assume that you are happy with it.