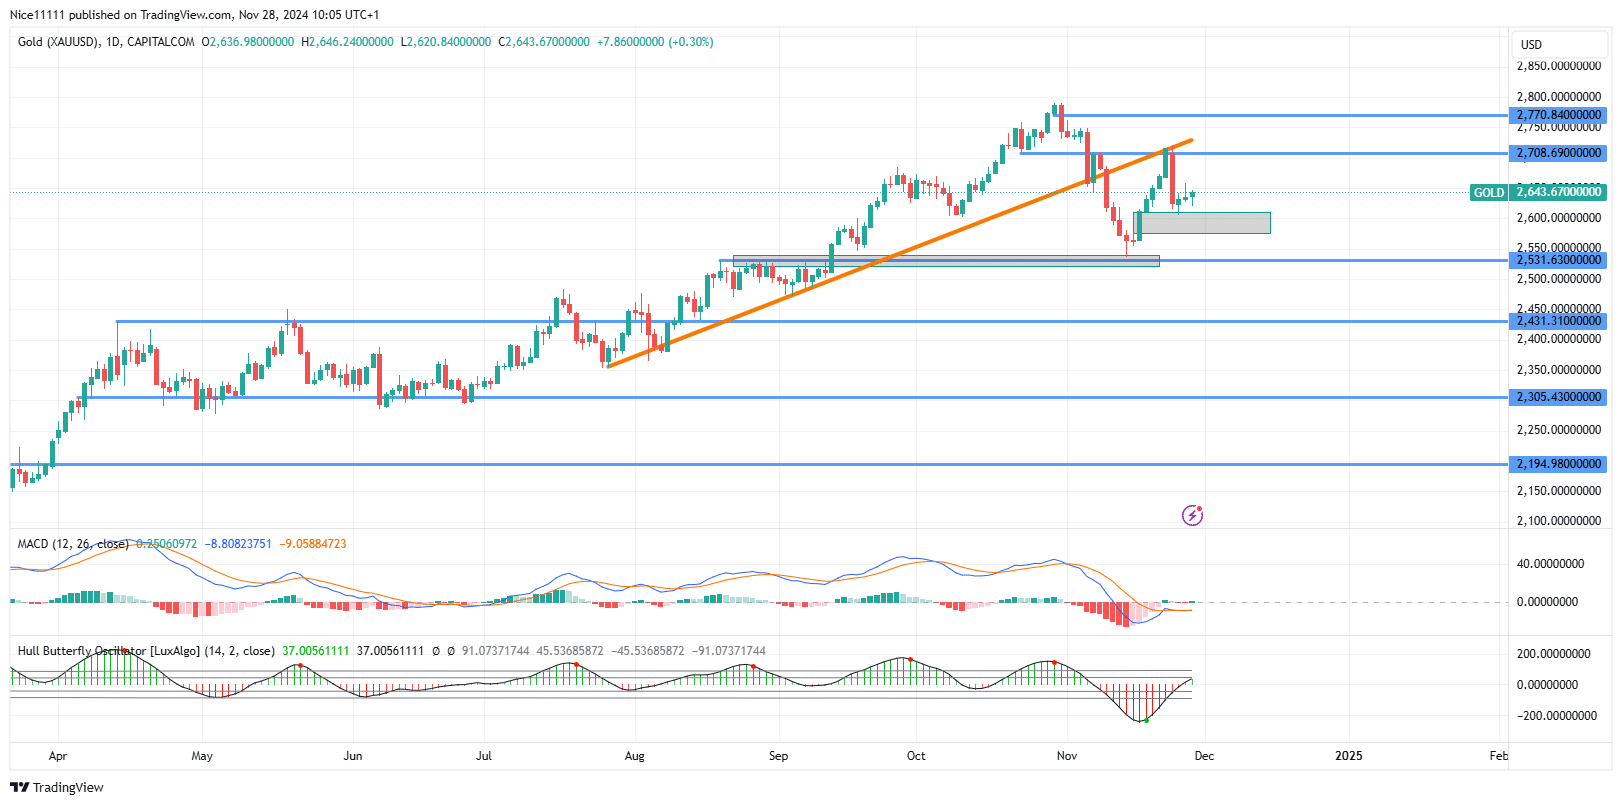
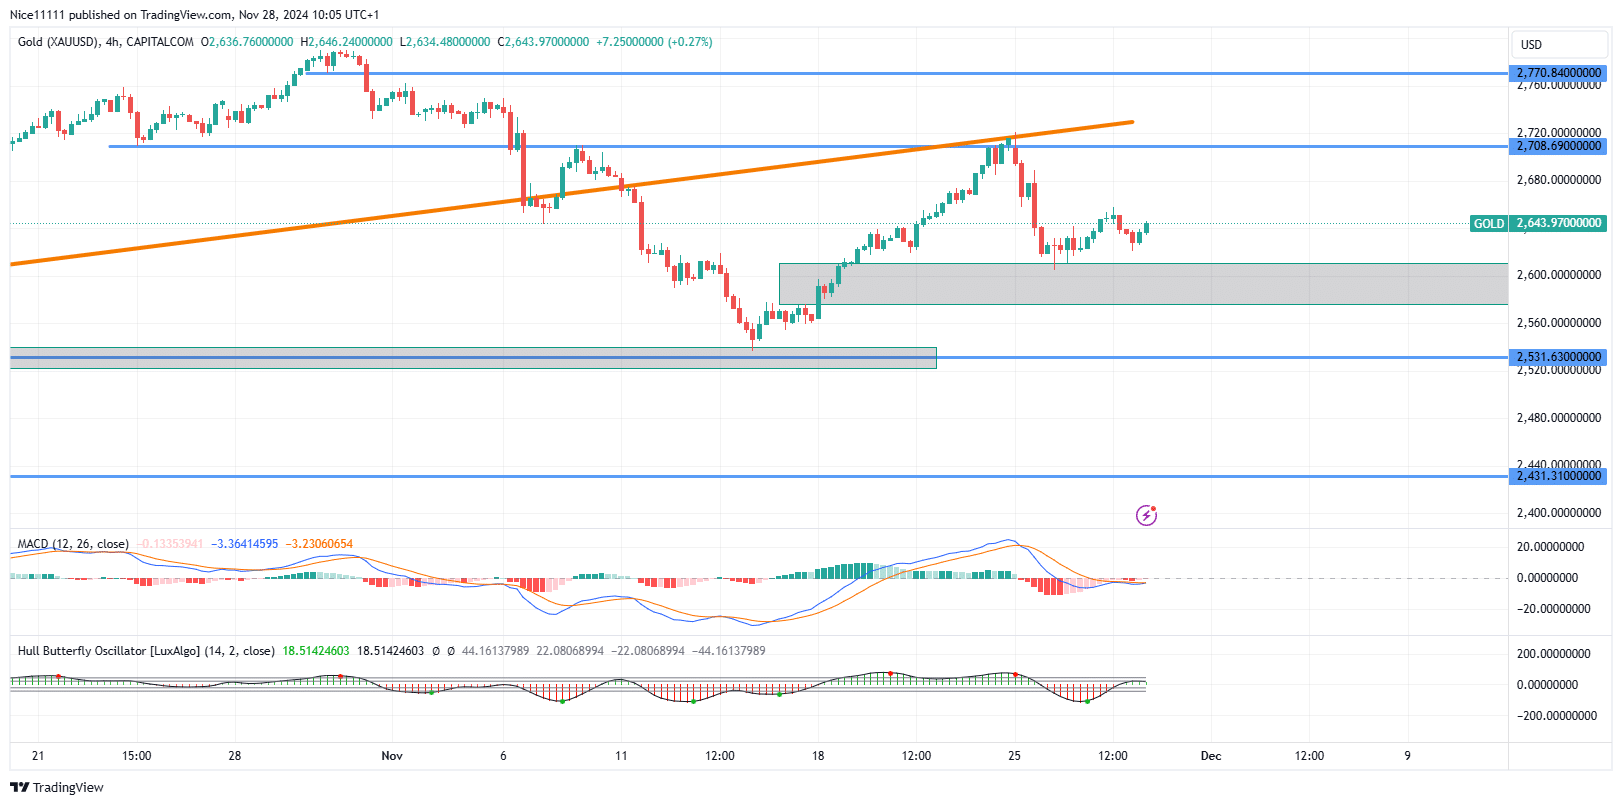
Gold experienced a bearish shift in November, breaking below a long-standing upward trendline. After the breakout, the price retraced to test this broken trendline, which now serves as resistance alongside the 2708 resistance zone.
The Hull Butterfly Indicator shows a steady weakening of bearish momentum during the retracement. Currently, it highlights a notable reduction in bearish strength.
During this month’s retest of the broken trendline, the price encountered resistance. Despite this, the MACD points to fading bearish momentum and hints at the potential start of a bullish phase.
Gold Short-Term Trend: Bearish
A clear breakout above the 2708.0 resistance level would confirm a bullish resurgence. Buyers are making active attempts to regain control, signaling a possible recovery in the uptrend. Traders watching forex signals are also closely monitoring gold’s next move for further insights.
Note: Learn2.trade is not a financial advisor. Do your research before investing your funds in any financial asset, product, or event. We are not responsible for your investment results.
Trade on MT4 with Leverage up to 1:500! Trade on MT4 with Leverage up to 1:500!
X
We use cookies to ensure that we give you the best experience on our website. If you continue to use this site we will assume that you are happy with it.