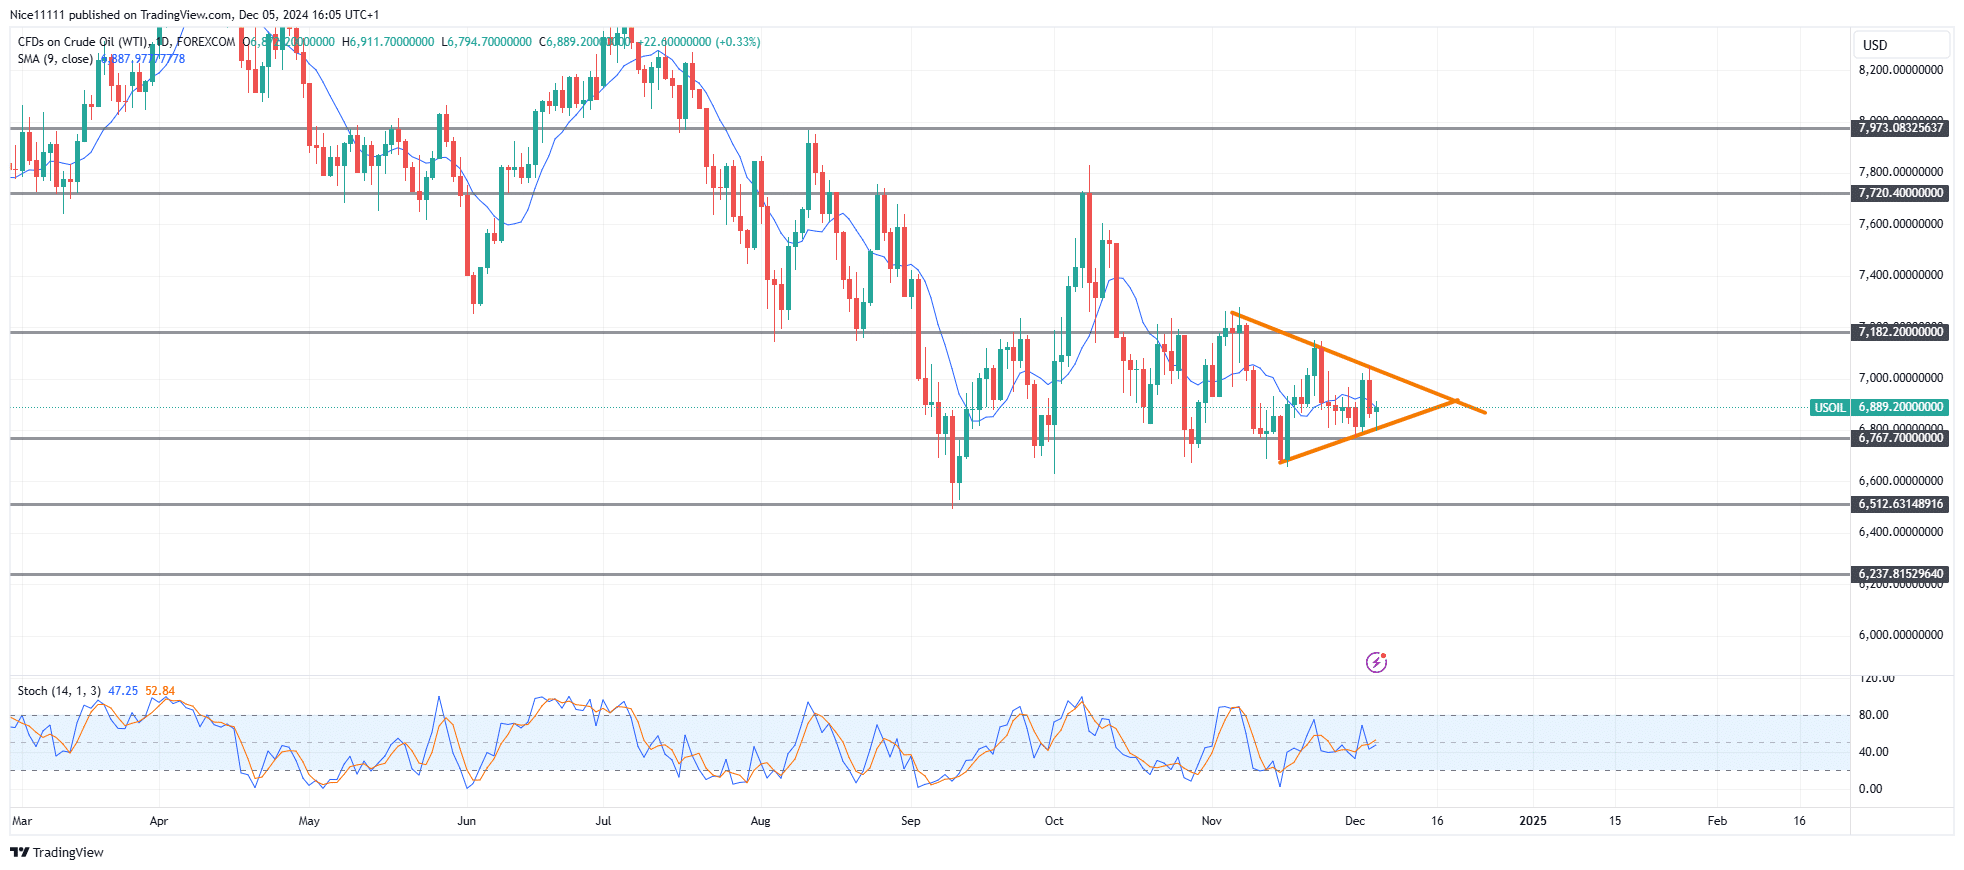
USOil remains confined between the resistance zone at 7182.0 and the demand level at 6767.0 on the daily timeframe. The development of lower highs and higher lows has formed a symmetrical triangle, reflecting market indecision and a lack of definitive direction.
Since July, USOil has experienced a steady price decline, with sellers encountering strong support at 6767.0. This level has effectively halted further downward momentum, as evidenced by five failed attempts to breach it.
The 9-period Moving Average currently rests between the resistance at 7182.0 and the support at 6767.0, signaling a lack of directional momentum. It aligns closely with daily candle bodies without trending distinctly above or below them.
The Stochastic Oscillator remains neutral, fluctuating around the mid-level of 40. This neutrality reflects the ongoing consolidation phase, as the indicator has not entered either the overbought or oversold zones.
USOil Short-Term Trend: Ranging
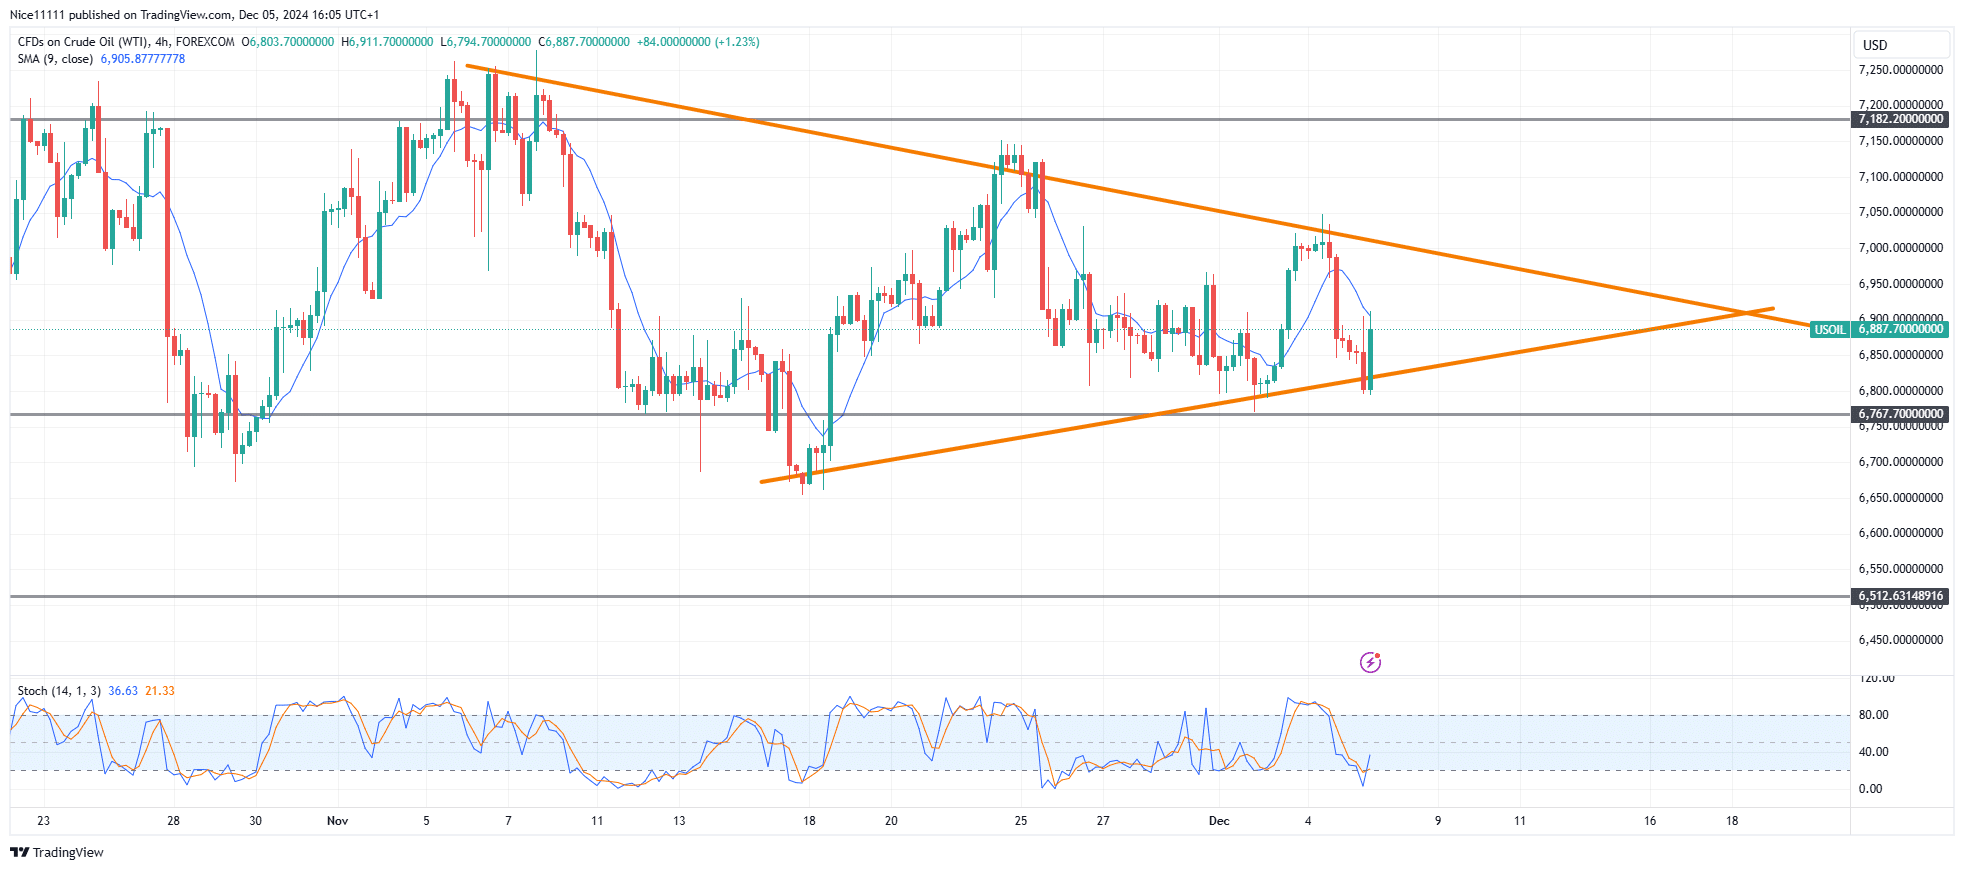
The symmetrical triangle formation signals an approaching breakout. Price action is progressively narrowing toward the apex of the triangle, suggesting the potential for a significant and volatile move.
A decisive breakout from this pattern will be key in determining USOil’s next trend. Traders should monitor the 7182.0 resistance and 6767.0 support levels closely, as these will likely influence the market’s direction. Integrating forex signals into trading strategies could enhance decision-making during this period of uncertainty.
Note: Learn2.trade is not a financial advisor. Do your research before investing your funds in any financial asset, product, or event. We are not responsible for your investment results.
Trade on MT4 with Leverage up to 1:500! Trade on MT4 with Leverage up to 1:500!
X
We use cookies to ensure that we give you the best experience on our website. If you continue to use this site we will assume that you are happy with it.