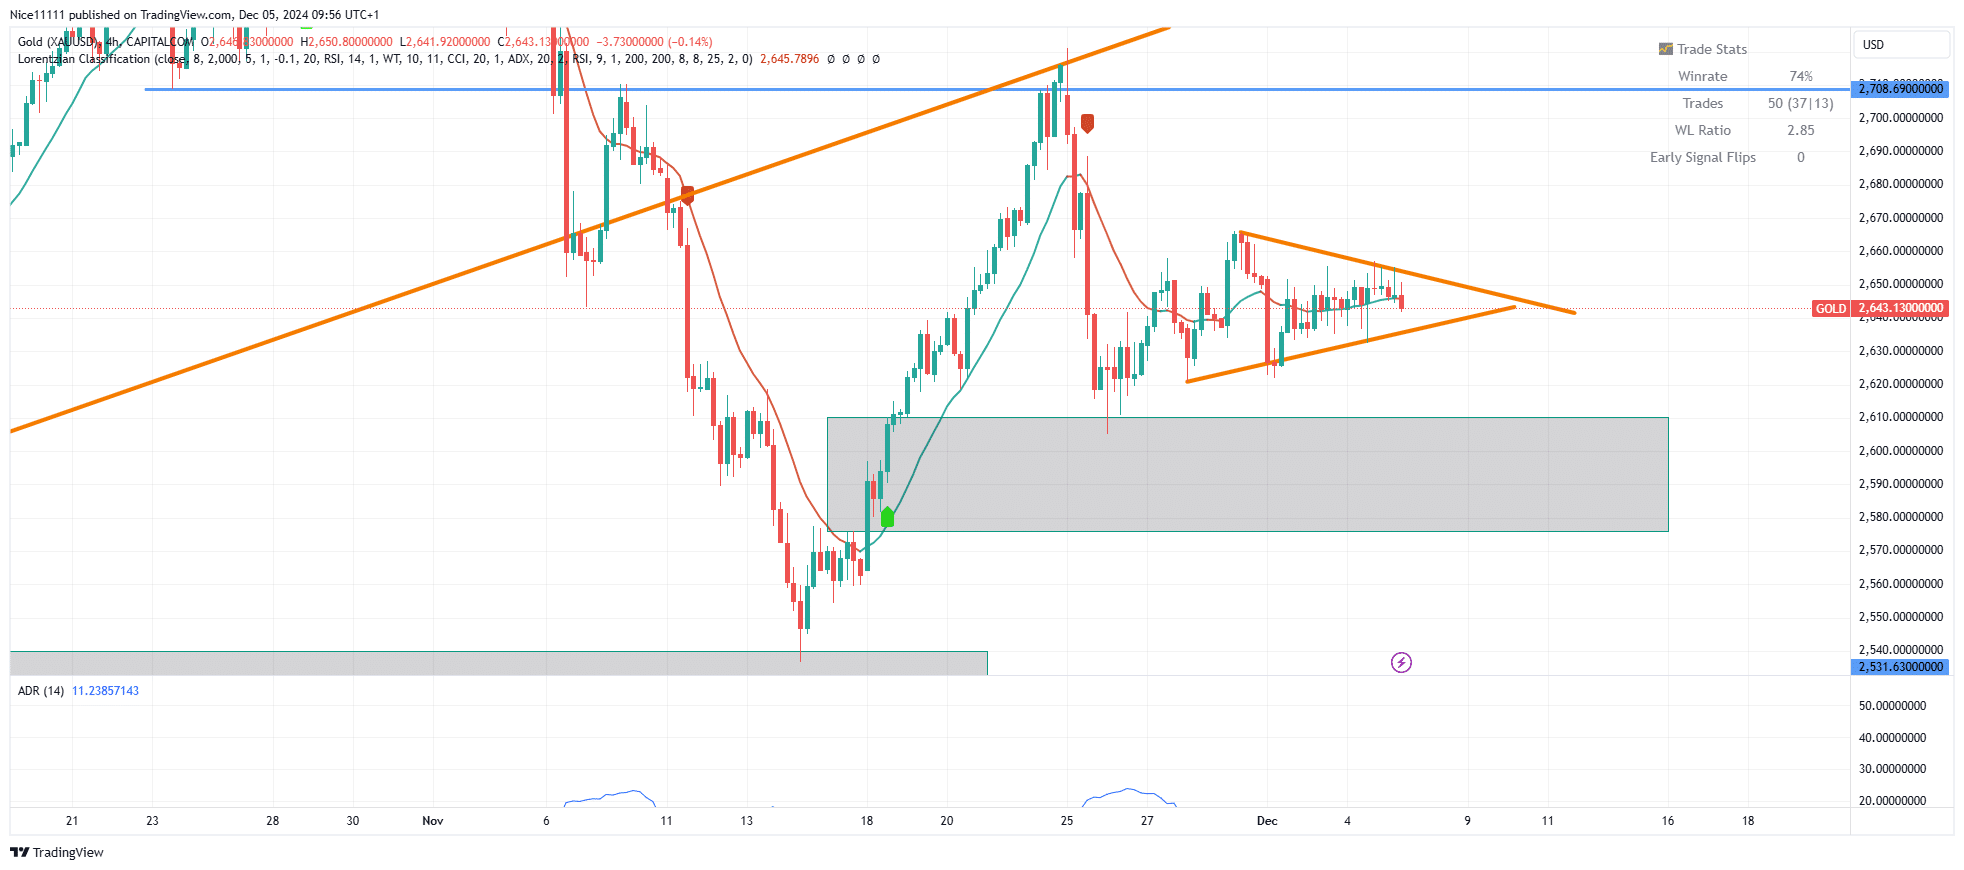
Gold is experiencing a balance of buying and selling pressures, leading to stagnation in price movement. This equilibrium between demand and supply has restricted significant market activity in recent sessions.
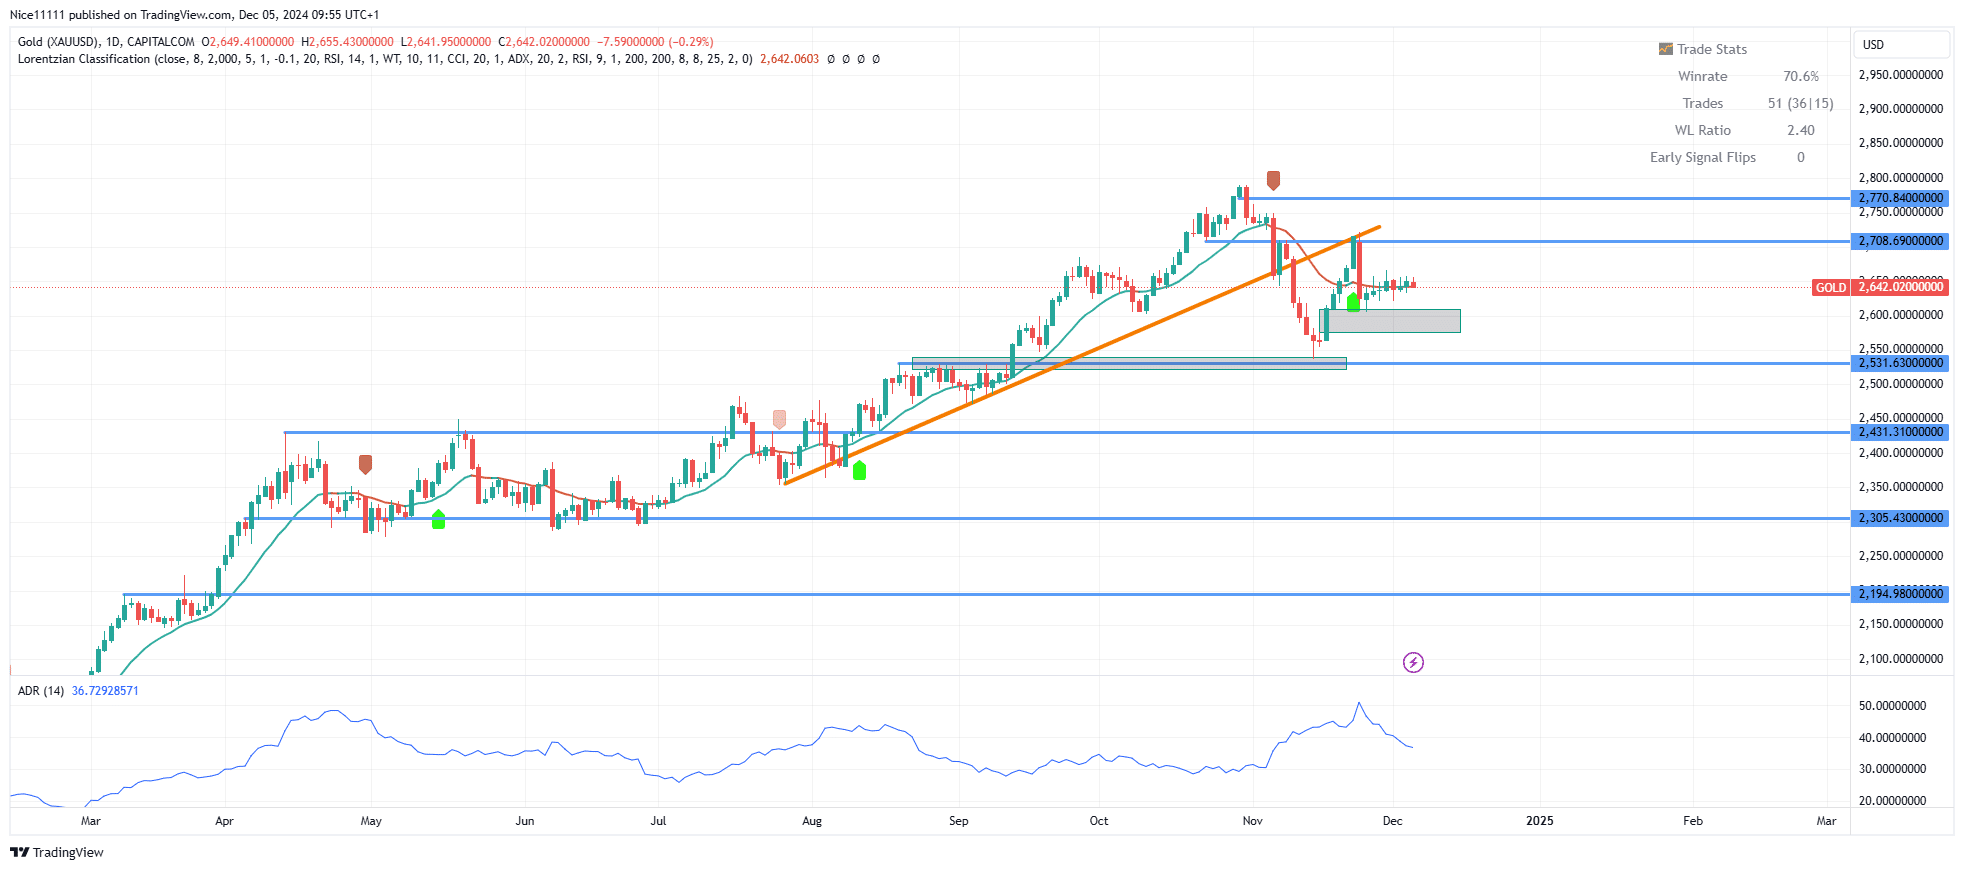
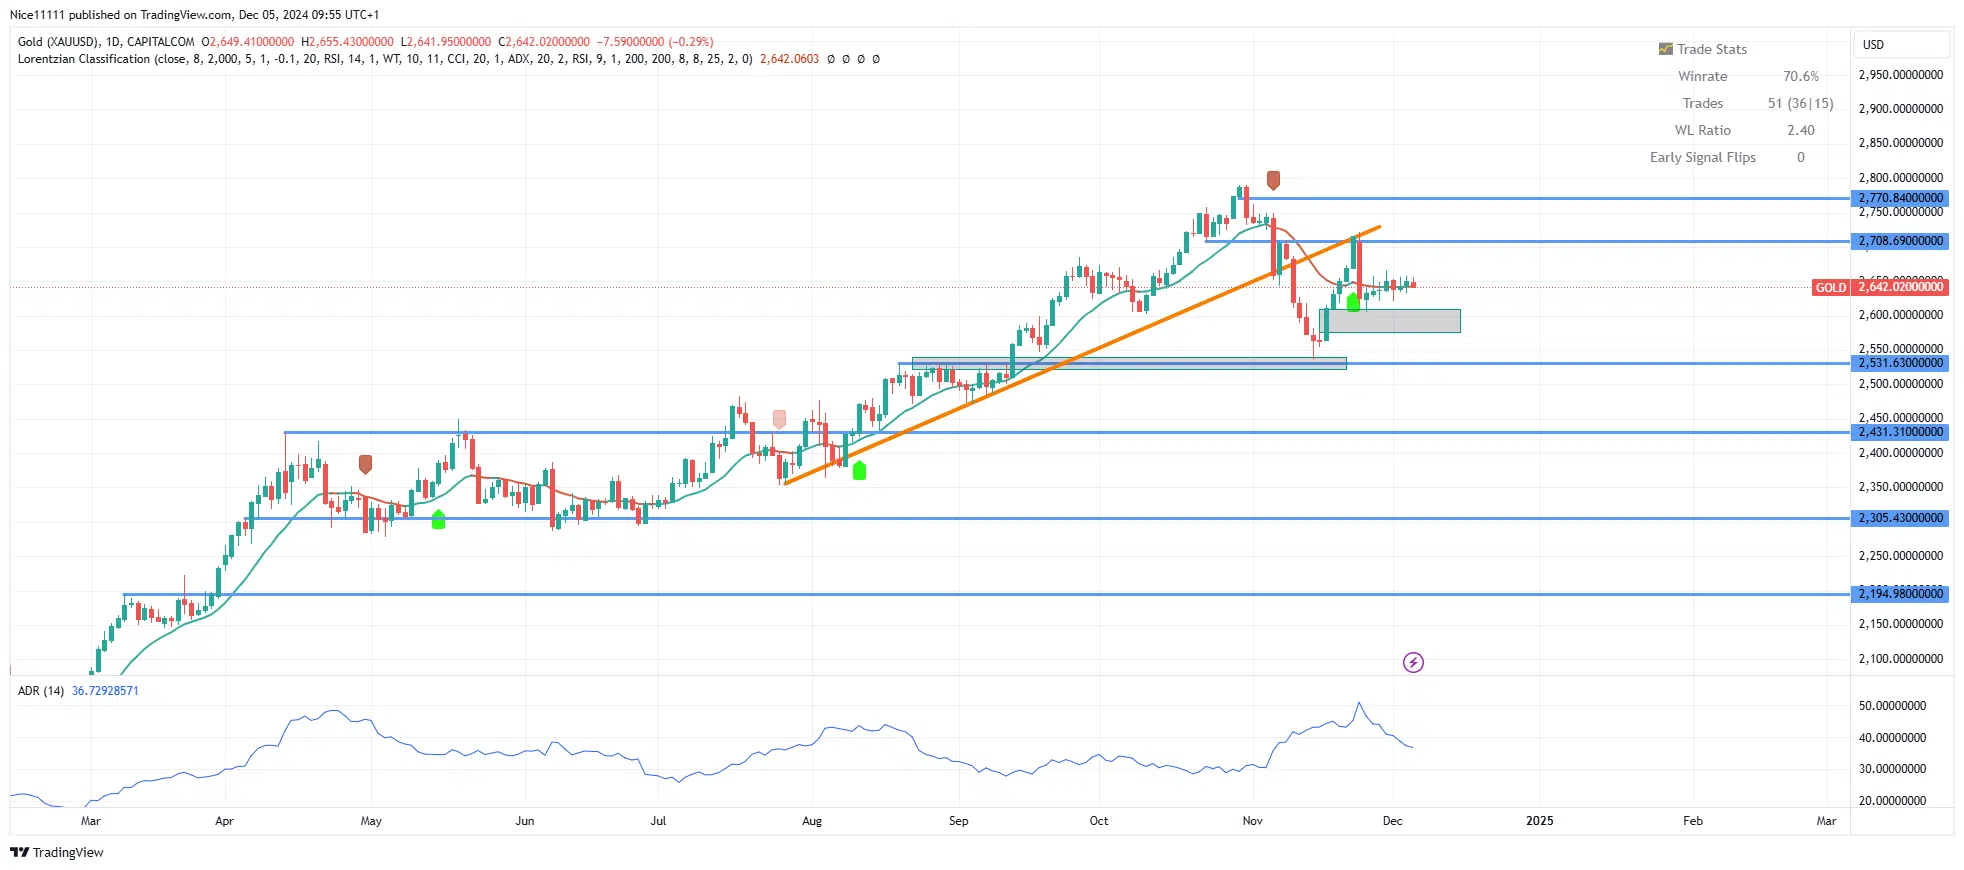
In November, gold prices broke below a critical supporting trendline on the daily chart, confirming a bearish trajectory. The Lorentizan Classification Indicator issued a shorting signal during this breakdown, marking the onset of substantial selling pressure. However, the downward movement was halted at the demand zone of 2531.0, a crucial support level that absorbed the selling momentum and prevented further declines.
After finding support, the market rallied to retest the previously broken trendline, creating a fair value gap (FVG) just above the key demand zone. This temporary bullish activity was met with resistance at the retested trendline, leading to a stalemate between buyers and sellers. The resulting equilibrium has left the market directionless, as highlighted by the declining Momentum Indicator, which signals a lack of strength on either side.
Gold Short-Term Trend: Ranging
On lower timeframes, the price has formed a symmetrical triangle, underscoring market indecision. A decisive break below the 2531.0 support would signal a continuation of the bearish trend. Alternatively, a breakout above the swing high at 2708.0 could set the stage for renewed bullish momentum. Until such a breakout occurs, gold remains range-bound, reflecting the prevailing balance in market forces. The integration of forex signals into trading strategies may help investors navigate this uncertain phase effectively.
Note: Learn2.trade is not a financial advisor. Do your research before investing your funds in any financial asset, product, or event. We are not responsible for your investment results.
Trade on MT4 with Leverage up to 1:500! Trade on MT4 with Leverage up to 1:500!
X
We use cookies to ensure that we give you the best experience on our website. If you continue to use this site we will assume that you are happy with it.