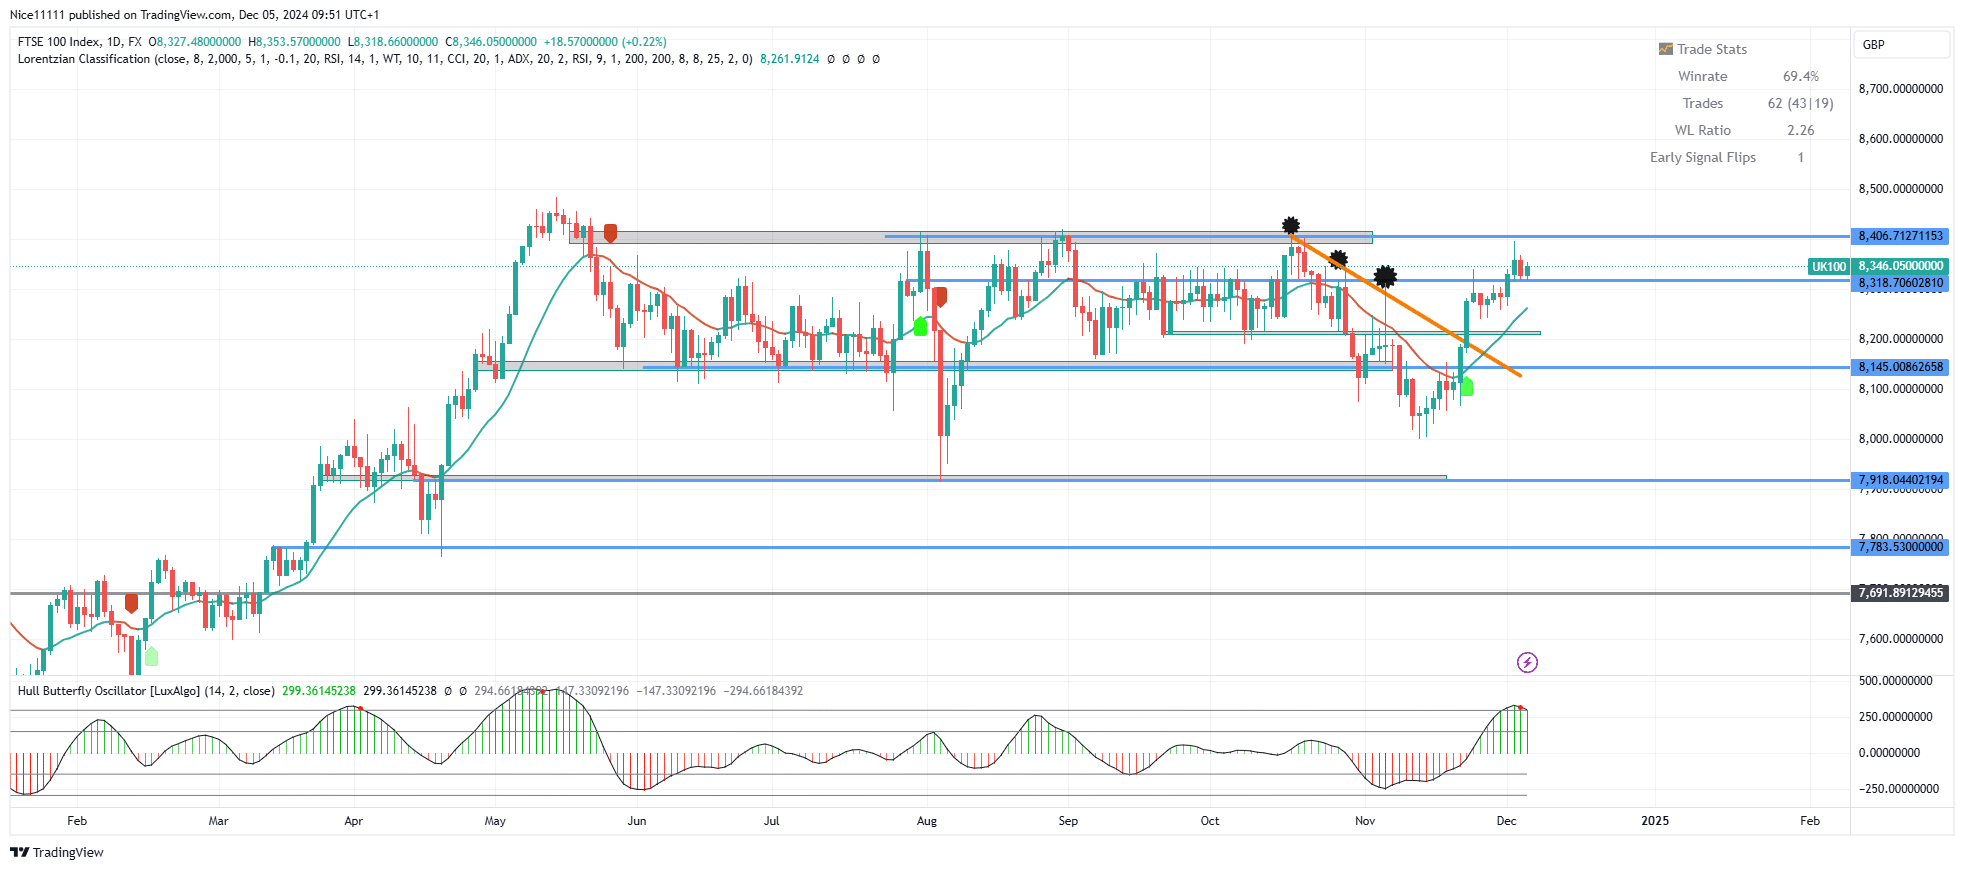
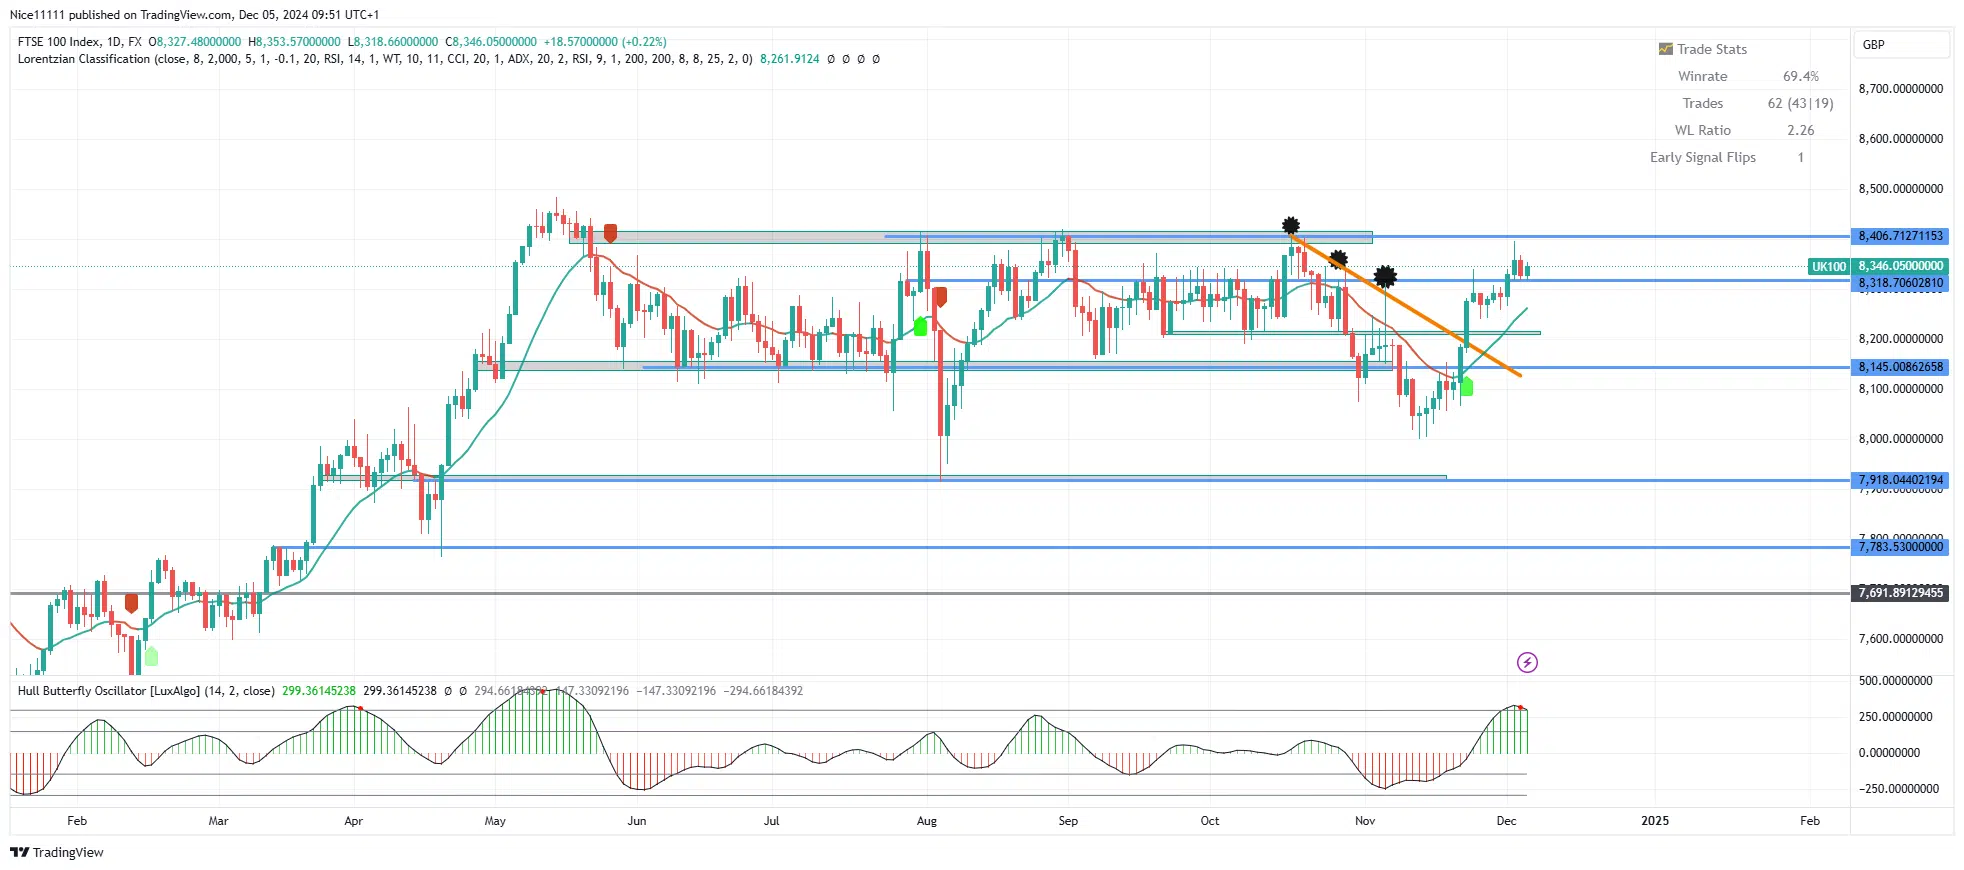
The FTSE 100 has shown a significant change in market structure, shifting from a bearish to a bullish trend after breaking a longstanding bearish trendline in November. The index recently touched a key supply zone and is now undergoing a pullback, potentially building momentum for continued bullish movement.
In November, the formation of a swing low followed by a swift recovery above 8145.0 signaled strong buying activity. This was reinforced by the Hull Butterfly indicator, which turned green, confirming bullish dominance. Simultaneously, the price broke above the bearish trendline on the daily chart, further validated by the Lorentizan Classification indicator, which issued a green tag to confirm the onset of an uptrend.
Following this, the price advanced beyond the resistance at 8318.0 before encountering another supply zone. While the Hull Butterfly indicator now signals an overbought condition, the broader trend remains bullish.
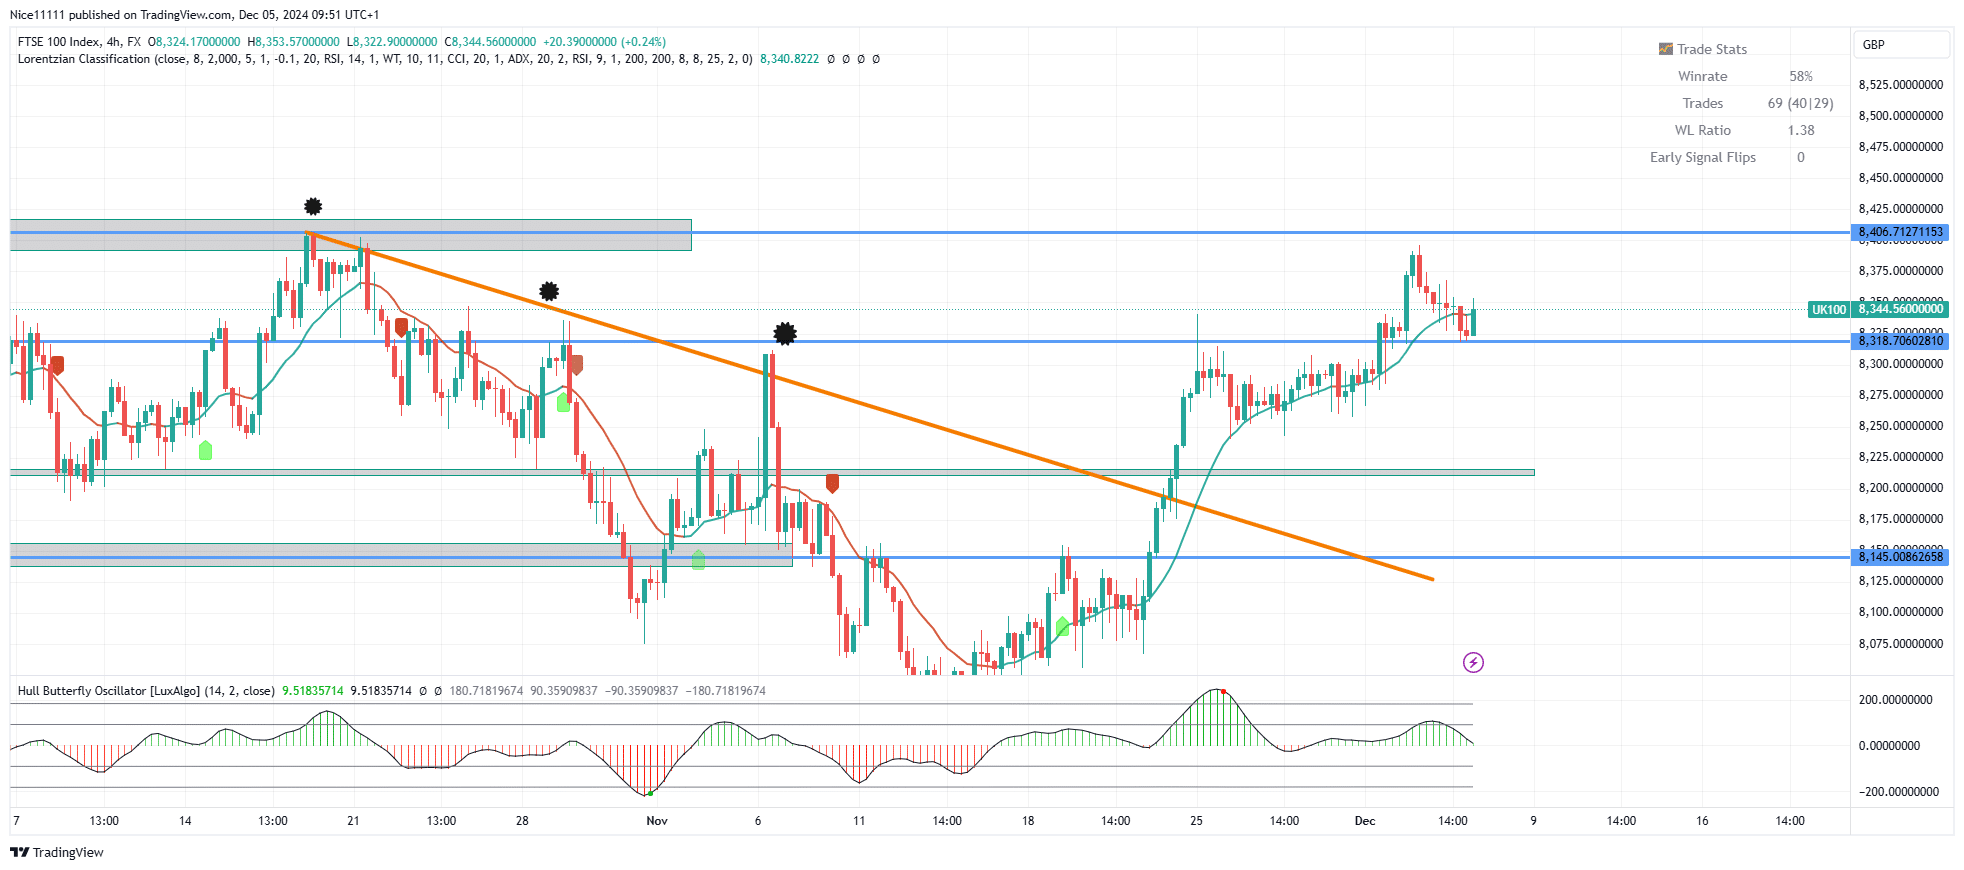
FTSE 100 Short-Term Trend: Bullish
The resistance at 8406.0 has led to a retracement, with the price pulling back to the broken resistance level at 8318.0. This retracement is expected to act as a support zone, potentially enabling the index to build strength and breach the 8406.0 supply zone.
The FTSE 100 maintains its bullish long-term trend, supported by robust technical indicators and strong price action. The strategic use of forex signals can further enhance market analysis in this context.
Note: Learn2.trade is not a financial advisor. Do your research before investing your funds in any financial asset, product, or event. We are not responsible for your investment results.
Trade on MT4 with Leverage up to 1:500! Trade on MT4 with Leverage up to 1:500!
X
We use cookies to ensure that we give you the best experience on our website. If you continue to use this site we will assume that you are happy with it.