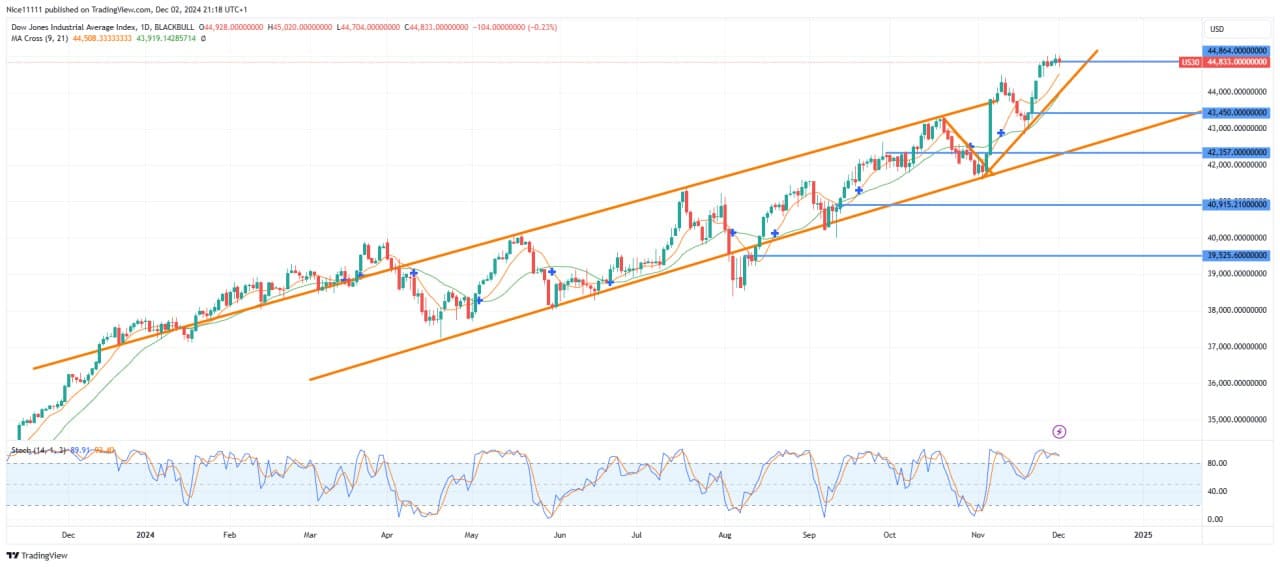
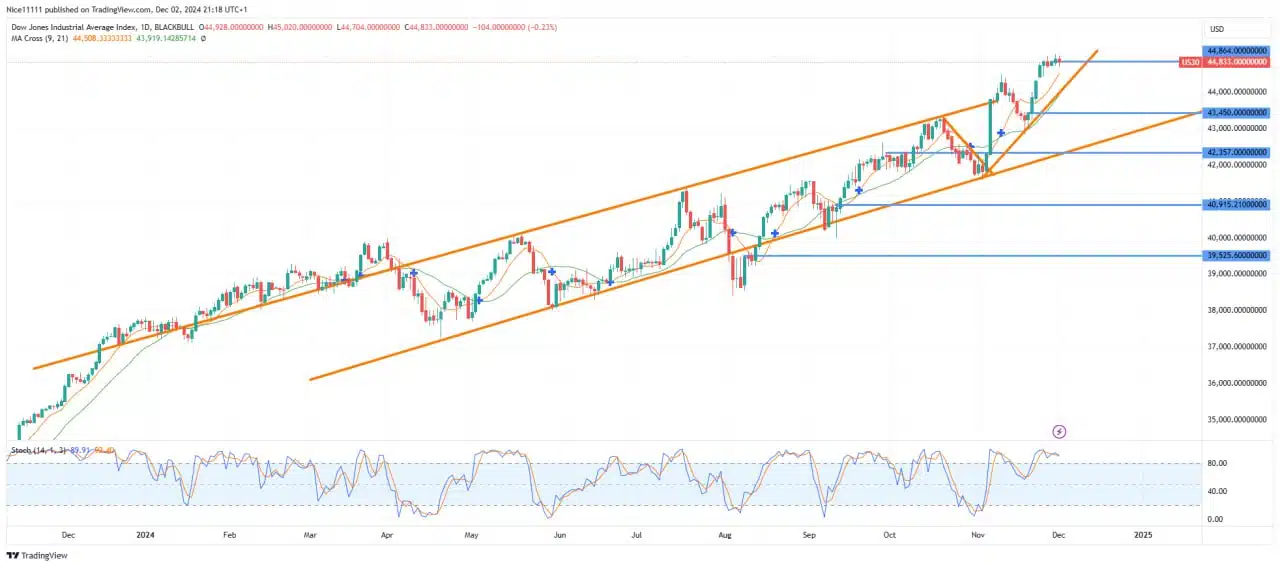
The US 30 index has seen a notable reduction in its average daily range since completing its bullish expansion from 43,450.0. Recent price movements have been characterized by sideways trading and smaller daily candles, signaling an accumulation phase. Historically, such phases often precede sharp market expansions.
The price action of the US 30 demonstrates a pattern of alternating between corrective phases and impulsive surges. Notably, the November pullback to the supporting trendline within the parallel channel was gradual, indicating a correction. Upon reaching the trendline, the Stochastic indicator moved into oversold territory, triggering a sharp price increase that shifted the market into an impulsive phase.
A subsequent pullback to the 21-period moving average provided a support zone, leading to the formation of consecutive bullish candles that propelled the price to 44,900.0.
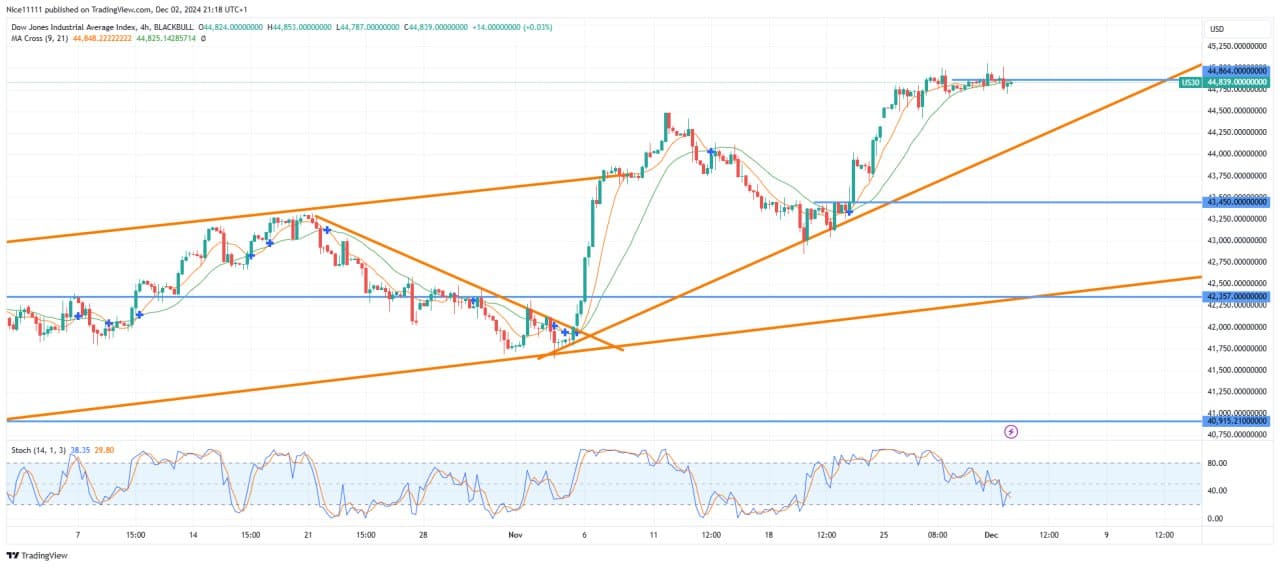
US 30 Short-Term Trend: Ranging
Since reaching 44,900.0, the index has been consolidating with reduced volatility and momentum. This range-bound behavior suggests the market is preparing for another aggressive price expansion. On the daily chart, the broader trend remains bullish, with expectations of the price resuming its upward movement and surpassing 45,000.0 in the upcoming sessions. The incorporation of forex signals may further support informed trading decisions in this context.
Note: Learn2.trade is not a financial advisor. Do your research before investing your funds in any financial asset, product, or event. We are not responsible for your investment results.
Trade on MT4 with Leverage up to 1:500! Trade on MT4 with Leverage up to 1:500!
X
We use cookies to ensure that we give you the best experience on our website. If you continue to use this site we will assume that you are happy with it.